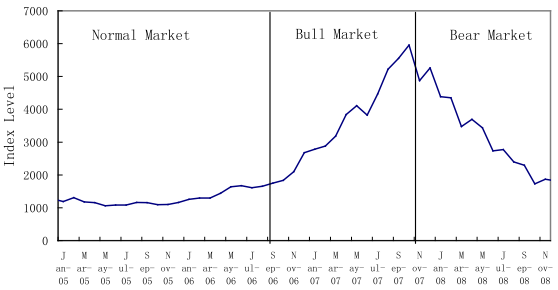
How do individual investors adjust trading behaviors during bull and bear markets? Are any such adjustments advantageous? In their December 2011 paper entitled “Don’t Confuse Brains with a Bull Market: Attribution Bias, Market Condition, and Trading Behavior of Individual Investors”, Zhen Shi and Na Wang examine the trading behaviors of individual investors during different market conditions. They apply a regime switching model to the Chinese stock market to identify: a normal market during January 2005 through August 2006; a bull market during September 2006 through October 2007; and, a bear market during November 2007 through November 2008. They define excessiveness of trading based on two measures: (1) the performance of stocks bought versus that of stocks sold; and, (2) the relationship between portfolio turnover and performance. Using the trading records of 15,040 randomly selected individual Chinese investors during January 2005 through November 2008 (2,357,959 trades), they find that:
- Average monthly value-weighted stock index returns are +10.3%, +1.6% and -7.7%, respectively, during the 14 bull, 20 normal and 13 bear market months in sample period (see the chart below). Volatility is highest during bear market conditions.
- Net underperformance of individuals during bull market conditions is dramatic. Average monthly market-adjusted gross (net) returns of individual investor portfolios are -0.74%, -1.1% and +1.54% (-10.2%, -3.6% and -2.0%), respectively, during bull, normal and bear market conditions.
- During bull market conditions:
- Stocks bought significantly underperform stocks sold by 0.47% the next month and 0.75% over the next three months. For the 10% of individuals who trade the most, stocks bought underperform stocks sold by 0.58% the next month and 1.0% over the next three months.
- The average monthly return on stocks bought during the prior month (prior three months) underperforms those sold during the prior month (prior three months) by 0.38% (0.18%).
- Poor trading decisions are due to poor security selection, not poor market timing.
- During bear market conditions, the performance of stocks bought is not significantly different from that of stocks sold.
- During normal market conditions, the relative performance of stocks bought and stocks sold is between those for bull and bear market conditions.
- Bull (bear) market conditions stimulate (inhibit) trading. The average monthly portfolio turnover during bull (bear) market conditions is 7.8% (5.2%), while the average risk-adjusted (for market, size, book-to-market and momentum) net portfolio return is -6.4% (-3.2%).
The following chart, taken from the paper, tracks the Shanghai Stock Exchange (SHSE) A-Share Index using monthly data from January 2005 through November 2008, showing the breakpoints for normal, bull and bear market conditions.

In summary, evidence from trading and performance indicates that individual investors detrimentally trade more excessively (are more overconfident) during bull market conditions than bear market conditions.
Cautions regarding findings include:
- Statistical significance tests assume tame return distributions.
- Trading frictions for individual Chinese investors may not be representative of those for individuals in other markets.
- Individual investors in the Chinese stock market may not be representative of those in other markets.