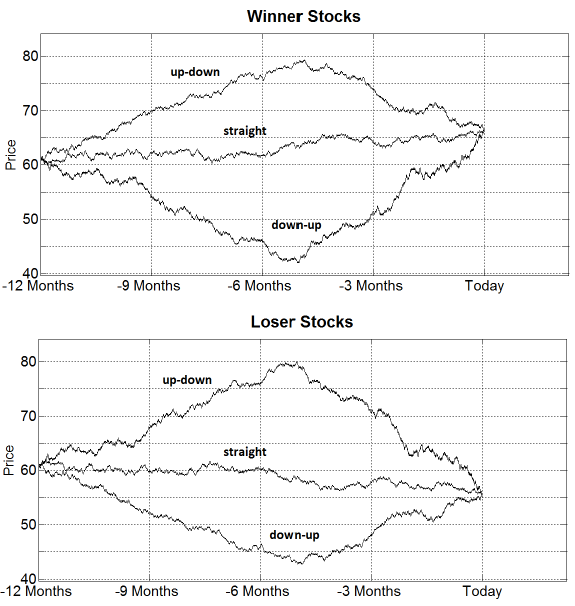
What makes investors happy with investment returns? In the April 2015 version of their paper entitled “All’s Well That Ends Well? On the Importance of How Returns Are Achieved”, Daniel Grosshans and Stefan Zeisberger employ a series of surveys to investigate how investor satisfaction depends on investment price path. Their main survey asks participants to imagine that they bought three winner stocks (10% terminal gain) and three loser stocks (10% terminal loss) one year ago, with the three in each set having distinct price paths: (1) down-up, (2) straight line (monotonic) and (3) up-down (see the figures below). It also asks how likely participants would be to hold or sell each stock, their minimum selling price and an estimate of the stock’s price after one more year. Using results from surveys of participants recruited via Amazon Mechanical Turk (MTurk) and of students in advanced finance courses, they find that:
- For both winner and loser stocks, 263 MTurk survey participants are most (least) satisfied when their investments first decline (advance) and then then advance (decline). Satisfaction with the up-down winner is on average even slightly negative, nearly as negative as that with the down-up loser. Results are robust to:
- Restricting MTurk participants to those with at least an average level of self-reported financial literacy.
- A separate survey of 58 advanced finance students at the University of Zurich.
- A separate, more numerically explicit, survey of 423 MTurk participants.
- In general, survey participants expect short-term trend continuation. However, on average, expected return:
- For down-up winners is 6.8% higher than for up-down winners.
- For up-down losers is 18.8% lower than for down-up losers.
- For straight line winners is larger in magnitude than for straight line losers.
- Overall and for down-up and up-down stocks, survey participants are more likely to sell winners than losers. For straight line stocks, they are more likely to sell losers.
- Survey participants tend to give minimum selling prices close to the current (purchase) price if the current price is above (below) the purchase price.
The following charts, taken from the paper, show the two sets of price trajectories used to measure survey participant satisfaction with investment outcomes. Winner stocks (upper graph) all have a terminal gain of 10%, and loser stocks (lower graph) all have a terminal loss of -10%.
In summary, evidence from surveys indicates that recovery from adversity is more emotionally satisfying for investors than failing to exit at peaks.
Findings may have implications for technical trading based on historical price patterns and for momentum strategies.
Cautions regarding findings include:
- The survey samples may not be representative of all investors, especially highly experienced ones.
- Hypothetical, retrospective feelings may not be the same as actual, real-time feelings.