Which fund family is better, Vanguard or Fidelity? In their April 2019 paper entitled “Vanguard versus Fidelity: Multidimensional Comparison of the Index Funds and ETFs of the Two Largest Mutual Fund Families”, Chong Li, Edward Tower and Rhona Zhang compare 21 matched Vanguard and Fidelity fund pairs in five ways: (1) before-tax and after-tax performance, (2) tax efficiency, (3) cost (expense ratio, turnover and short-term redemption fees), (4) diversification and (5) benchmark tracking precision. They consider 10 domestic equity and international equity index mutual funds and 11 sector exchange-trade funds (ETF). Their objective is to aid investors in selecting a fund provider. Using fund performance, cost, holdings and benchmark as of the end of 2018, they find that:
- Regarding returns (see the summary table below):
- For before-tax returns, Fidelity wins 12 of 21 pairs has a slight edge based on the median.
- For after-tax returns, Vanguard wins 14 of 21 pairs and has a material edge based on the median.
- For tax efficiency, Vanguard wins 18 of 21 pairs and has a material edge based on the median.
- Regarding costs:
- For expense ratio, Fidelity wins all 21 pairs and has a modest edge based on the median.
- For turnover, Vanguard wins 14 of 21 pairs and has a modest edge based on the median.
- The Fidelity website describes short-term redemption fees for some mutual funds in the range 0.5% to 2.0% on shares held less than 30 days to 180 days, depending on the fund. However, a Fidelity representative stated there are generally no short-term redemption fees for Fidelity (in-house) mutual funds. Vanguard describes short-term redemption fees for a few in-house mutual funds in the range 0.25% to 1.00% and a flat $50 for no-load mutual funds from other companies for shares held less than 60 days.
- For diversification (number of securities held in a fund), Vanguard wins 15 of 21 pairs.
- For benchmark tracking precision, Fidelity wins 9 of 21 pairs and Vanguard wins 7, giving a slight edge to Fidelity. However, Vanguard benchmarks (mainly CRSP indexes) are inherently more tax efficient than Fidelity benchmarks (mainly Russell indexes).
The following table, extracted from the paper, summarizes comparisons of the selected Vanguard and Fidelity funds across metrics.
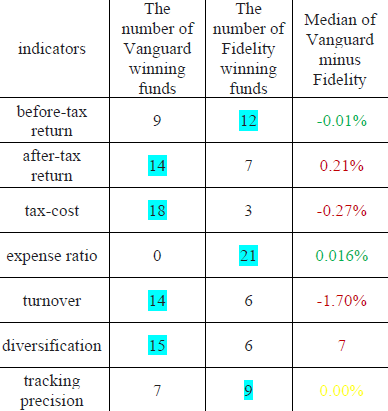
In summary, evidence indicates that Vanguard wins after-tax return (materially), tax efficiency, turnover and diversification. Fidelity wins before-tax return (slightly), expense ratio and tracking precision.
Cautions regarding findings include:
- The approach appears not to capture variations/trends in metrics such as expense ratio over time.
- Vanguard and Fidelity may offer different services not quantified by the chosen metrics.