Do investment choices derived from experiencing and visualizing returns differ from those derived from analyzing numerical return distribution statistics? In their May 2010 paper entitled “How Much Risk Can I Handle? The Role of Experience Sampling and Graphical Displays on One’s Investment Risk Appetite”, Emily Haisley, Christine Kaufmann and Martin Weber examine how different types of five-year investment performance information (numerical statistics, simulations of portfolio allocation outcomes, graphical displays of the distribution of these outcomes and a simulation/graphics combination) influence the investment risk taking of individuals in an experimental setting. Using data from a series of three experiments in which 133 German, 188 American and 362 American participants choose allocations to a risk-free and a risky asset, they conclude that:
- Individuals who learn about portfolio allocation risk-return via simulated outcomes with graphical return distributions tend to take more risk than those who review numerical return-variability statistics, regardless of financial literacy, stock ownership, age, education and income.
- Despite taking greater risk, the graphical simulation learners do not exhibit post-allocation regret, and they choose the same or higher level of risk for a subsequent allocation.
- The simulation experience appears to be more influential in boosting risk-taking than graphical presentation of simulation outcomes.
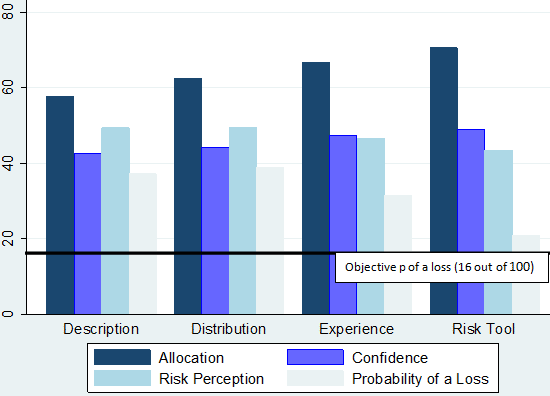
- The willingness of graphical simulation learners to take greater risk than numerical statistics learners derives from: a decrease in perceived risk; an increase in confidence about the risky asset; and, a decrease in the estimated probability of a loss (see the chart below). Perceived probability of a loss impacts investment decisions more strongly than perceived probability of a large gain.
- Graphical simulation learners are more accurate than numerical statistics learners in estimating both expected return and probability of a loss, but still substantially underestimate probability of a large gain.
The following chart, taken from the paper, summarizes the average allocation to the risky asset and the strengths of the cognitive mediators of this allocation for four experimental groups:
- The “Description” group receives only numerical statistics about return and risk for allocations as selected.
- The “Distribution” group sees graphical displays of the return distributions for allocations as selected.
- The “Experience” group receives one outcome after another for allocations as selected but not a graphical summary of outcomes.
- The “Risk Tool” group receives one outcome after another for allocations as selected, and the outcomes accumulate in an accompanying graphical distribution.
Compared to numerical statistics, simulations with graphical display of outcomes on average lower risk perception, increase confidence and (most dramatically) decrease perceived probability of a loss associated with investment allocations.

In summary, evidence from laboratory experiments indicates that simulated experience, especially with graphical display of results, instills a more realistic grasp of investment choices than does exposure to numerical statistics.
In other words, investors/traders may learn more effectively from plotting the results of practice trades on a graph than from statistical analysis.