
What proportion of mutual funds truly, after accounting for luck, generate positive alpha? Is there a reliable way to find such funds? In the March 2008 version of their paper entitled “False Discoveries in Mutual Fund Performance: Measuring Luck in Estimated Alphas”, Laurent Barras, Olivier Scaillet and Russ Wermers apply a new technique to measure the role of luck across a large sample of mutual funds. Using monthly returns for 2,076 U.S. actively managed domestic equity mutual funds (1,304 growth, 388 aggressive growth and 384 growth and income) existing for at least 60 months during 1975-2006, they conclude that:
- The annualized alphas for the entire (equally-weighted) sample and for the three category subsamples are negative, ranging from -0.45% to -0.60%.
- Based on return histories across the entire sample period, only 0.6% of funds exhibit truly positive long-term four-factor (market, size, book-to-market and momentum) alphas after expenses and trading costs, while 26.6% exhibit truly negative alphas. The balance of 72.8% of funds display skill just sufficient to cover expenses and trading costs.
- Based on returns of funds existing throughout five-year subperiods, only 2.4% exhibit truly positive short-term alpha.
- Unskilled funds reside throughout the left tail of the return distribution, but skilled ones concentrate in the extreme right tail.
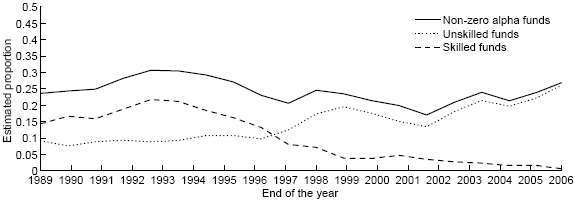
- From 1989 to 2006, the proportion of skilled (unskilled) funds declines from 14.4% to 0.6% (rises from 9.2% to 26.6%), while the estimated alpha for the entire sample of funds falls from 0.16% to -0.97% per year. (See the chart below.)
- A strategy of iteratively constructing an equally-weighted portfolio of funds from the extreme right tail of returns for five-year subperiods (short-term winners) generates annual alphas of 1.15% to 1.45%. Key to the success of this strategy are adjustments to the proportion of funds deemed short-term winners according to changes in the proportion of skilled funds over time.
- Skilled managers concentrate in the aggressive growth category. About 5% of aggressive growth funds exhibit true skill, while no growth and income funds show true skill.
- Before expenses but after trading costs, about 9.6% of funds exhibit true alpha, indicating that the fund managers (but not the fund investors) can beat the market.
The following chart, taken from the paper, shows the evolution of the proportions of skilled and unskilled funds during 1989-2006 based on complete to-date fund return histories. Skilled (unskilled) means a truly positive (negative) four-factor alpha. The first proportions at the end of 1989 use 1975-1989, while the last ones in 2006 use 1975-2006. The chart shows that the proportion of truly outperforming funds has dwindled nearly to zero.
In summary, dramatic growth in the number of actively managed mutual funds has driven the proportion of truly skilled funds down, without commensurate reduction in average fund fees and expenses.
Frequently Asked Questions
What does mutual fund alpha mean in investing?
Mutual fund alpha is the return a fund earns beyond what its exposure to risk factors would predict. In the Barras, Scaillet and Wermers study, alpha is measured with a four-factor model (market, size, book-to-market and momentum) after expenses and trading costs. A positive alpha indicates manager skill, while a negative alpha indicates the fund underperforms its risk-adjusted benchmark.
Do actively managed mutual funds actually generate positive alpha after accounting for luck?
Actively managed mutual funds rarely generate truly positive alpha after accounting for luck. In a sample of 2,076 U.S. domestic equity funds over 1975-2006, only 0.6% had truly positive long-term four-factor alphas after expenses and trading costs, while 26.6% had truly negative alphas. The remaining 72.8% showed skill just sufficient to cover expenses and trading costs.
How do researchers separate luck from skill when measuring mutual fund performance?
Researchers separate luck from skill by applying a statistical technique that estimates the proportion of funds with truly positive, zero or negative alphas, rather than just ranking raw performance. The study used monthly returns for 2,076 U.S. actively managed domestic equity funds with at least 60 months of history during 1975-2006, evaluated with a four-factor alpha model. Funds with truly positive alphas concentrate in the extreme right tail of the return distribution, while unskilled funds populate the left tail.
Do mutual fund managers have skill before fees, and how does that compare with investor returns after fees?
Mutual fund managers show more skill before expenses than investors capture after expenses. Before expenses but after trading costs, about 9.6% of funds exhibit true positive alpha, indicating managers can beat the market, whereas only 0.6% do so for investors after expenses over the full 1975-2006 period. Skill is also concentrated in aggressive growth funds (about 5% skilled), with no growth and income funds showing true skill.
Why has the share of skilled mutual funds declined over time, and what does that mean for picking winners?
The share of skilled mutual funds has declined because dramatic growth in the number of actively managed funds has driven the proportion of truly skilled funds down without a commensurate reduction in fees and expenses. From 1989 to 2006, skilled funds fell from 14.4% to 0.6% while unskilled funds rose from 9.2% to 26.6%. Picking winners remains difficult, though a strategy of buying five-year short-term winners, adjusted for the changing proportion of skilled funds, produced annual alphas of 1.15% to 1.45% in the study.