Might the relative sizes of the gaps between analyst target and actual prices indicate degrees of current misvaluation? In other words, is a stock with analyst target price twice its current price a better buy than a stock presently at or near its target price? In their February 2006 paper entitled “Target Prices, Relative Valuations and the Premium for Liquidity Provision”, Zhi Da and Ernst Schaumburg investigate the usefulness of relative gaps between target and actual stock prices as an indicator of misvaluations. Using recently issued target prices for about 1,700 stocks each month over the period 1996-2004, they conclude that:
- Target-actual relative price gaps are economically and statistically significant indicators of future returns.
- A sector-neutral portfolio rebalanced monthly to be long S&P 500 stocks with the largest target-actual relative price gaps and short S&P 500 stocks with the smallest gaps earns an average risk-adjusted return of about 2% per month during 1999-2004 before transaction costs.
- Sector neutrality (weighting each sector equally) and monthly rebalancing are critical to this result.
- This strategy works best: (1) for small value stocks; (2) in certain sectors such as consumer discretionary, industrials, materials and financials; and, (3) in the month of January.
- This abnormal return correlates with technical liquidity measures such as the bid-ask spread, price impact and changes in signed trading volume. This correlation indicates that very large or very small target-actual relative price gaps are temporary liquidity phenomena rather than long-term fundamental misvaluations. The liquidity phenomena reflect unusual information asymmetries between expert analysts and the market at large.
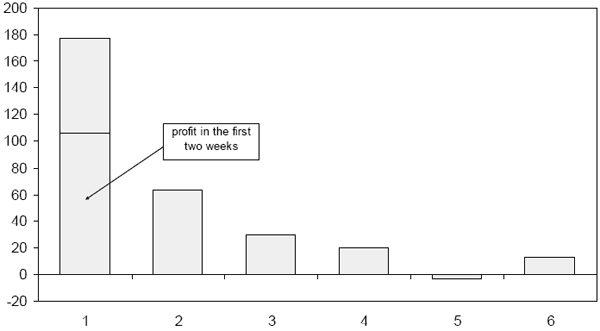
The following chart, taken from the paper, shows the average return (in basis points on the vertical axis) by month (on the horizontal axis) for portfolios long S&P 500 stocks with the largest target-actual relative price gaps and short S&P 500 stocks with the smallest gaps. It shows that most of the returns come during the first month as gaps revert to normal. Hence, monthly rebalancing is critical to outperformance.

In summary, analysts are good for identifying the relative value of stocks within sectors in which they are experts, but not for forecasting macro factors that drive sector and overall market movements.