Do retail investors rationally account for risks as modeled in academic research when choosing actively managed equity mutual funds? In their March 2019 paper entitled “What Do Mutual Fund Investors Really Care About?”, Itzhak Ben-David, Jiacui Li, Andrea Rossi and Yang Song investigate whether simple, well-known signals explain active mutual fund investor behavior better than academic asset pricing models. Specifically, they compare abilities of Morningstar’s star ratings and recent returns versus formal pricing models to predict net fund flows. They consider the Capital Asset Pricing Model (CAPM) and alphas calculated with 1-factor (or market-adjusted), 3-factor (plus size and book-to-market) and 4-factor (plus momentum) models of stock returns. They consider degree of agreement between signals for a fund (such as number of Morningstar stars and sign of a factor model alpha) and the sign of net capital flow for that fund. They also analyze spreads between net flows to top and bottom funds ranked according to Morningstar stars and fund alphas, taking the number of 5-star and 1-star funds to determine the number of top-ranked and bottom-ranked funds, respectively. Using monthly returns and Morningstar ratings for 3,432 actively managed U.S. equity mutual funds and contemporaneous market, size, book-to-market and momentum factor returns during January 1991 through December 2011 (to match prior research), they find that:
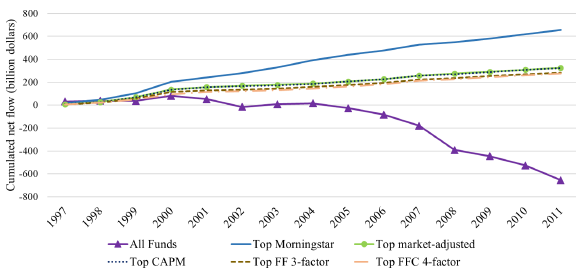
- Over the sample period, Morningstar 5-star funds attract net $656 billion, while funds with the highest factor model alphas attract net $274 billion to $326 billion (see the chart below).
- Morningstar rating agrees with direction of net flow for 67.9% of funds, while CAPM sign agrees for 60.6% and signs of alphas for factor models agree for 57.0% to 59.9% of funds.
- 67.3% (16.8%) of Morningstar 5-star (1-star) fund-months have positive net flows for a spread of 50.6%, compared to 40.6% to 45.8% spreads for CAPM and factor model alphas. CAPM works no better than unadjusted fund returns.
- Findings are the same before and after July 2002, when Morningstar began segregating funds into size and value categories.
- Extending the sample to the end of 2017 does not materially affect findings.
The following chart, taken from the paper, compares aggregate net flows to top-ranked funds according to Morningstar ratings (5-star) and to the same number of top-ranked funds according to CAPM and to alphas based on widely used 1-factor (market-adjusted), 3-factor (FF) and 4-factor (FFC) models of stock returns. Notable points are:
- Morningstar rating is consistently (each year) the winner for predicting net flow.
- There is very little difference in the abilities of CAPM and factor models to predict net flow. Return chasing (1-factor model) is at least as good as the other models and perhaps marginally more predictive than multi-factor models.
- Funds not in the top ranks of any of the signals are persistently losing capital.
In summary, evidence supports belief that retail mutual fund investors naively use Morningstar ratings and chase past returns to pick actively managed equity mutual funds.
Cautions regarding findings include:
- The study focuses on future fund net flows and not effectiveness of different ways to rank mutual funds regarding their future performance. For Morningstar ratings, see:
- Screening mutual funds based on multi-factor models of returns may be costly/impractical for retail investors.