How do financial advisors affect the investing practices of individual investors? Does their advice decisively improve client performance, or are other factors more explanatory? In their February 2009 paper entitled “The Influence of Financial Advisors on Household Portfolios: A Study on Private Investors Switching to Financial Advice”, Ralf Gerhardt and Andreas Hackethal compare the portfolios and transactions of advised and non-advised German investors to determine the effects of advice. They further decompose the sample of investors to explore whether differences between advised and non-advised arise from the advice per se or from investor socio-demographics or trading frequency. Using portfolio compositions and transactions for over 65,000 German investors during February 2006 through July 2007, including 597 who initiated a relationship with a financial advisor during that period, they conclude that:
- Advised investors are more likely to be female, old, married, risk-averse, wealthy and rational (have a regular savings plan) than non-advised investors.
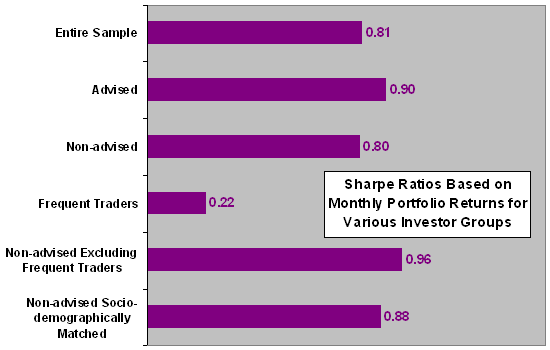
- Advised investors have more diversified portfolios, trade less and have a higher aggregate portfolio Sharpe ratio than do non-advised investors (0.90 versus 0.80).
- Frequent traders, with aggregate Sharpe ratio 0.22, contribute disproportionately and strongly to the underperformance of non-advised investors. Non-advised investors who are not frequent traders have a higher aggregate Sharpe ratio than advised investors (0.96 versus 0.90).
- Non-advised investors who match advised investors in terms of socio-demographics have a Sharpe ratio comparable to that of advised investors (0.88 versus 0.90). However, their portfolios are more speculative, less balanced between equity and non-equity, and otherwise less diversified than the portfolios of advised investors. They are also more prone to overtrading.
- The portfolios of investors just after retaining a financial advisor exhibit relatively high trading activity for restructuring to increase diversification and otherwise lower risk (less home bias and more passive investments). Advisors do not sell expensive products to their customers, but appear to prefer products that involve kickbacks for advisors.
The following chart, constructed from data in the paper, compares the aggregate Sharpe ratios as computed from the last 25 monthly portfolio returns during the sample period for various groups of investors, as follows:
- The entire sample of over 65,000 investors.
- The subsample of approximately 7,000 advised investors.
- The subsample of approximately 58,000 non-advised investors.
- The subsample of approximately 12,000 investors who are frequent traders.
- The subsample of approximately 46,000 non-advised investors who are not frequent traders.
- The subsample of approximately 7,000 non-advised investors who are socio-demographically most like the advised traders.
Results show that trading frequency is the most obvious indicator of risk-adjusted performance. All other Sharpe ratios fall into a fairly tight range.

In summary, evidence from this fairly short-term study supports a belief that heavy trading tends to depress risk-adjusted investing performance, but it does not indicate that advised investors outperform similarly motivated non-advised investors.
Might some of the conclusions from this study be peculiar to the state of equity markets during 2006-2007?