
What are the trading behaviors of the best-performing hedge funds? In his June 2013 paper entitled “How do Hedge Fund ‘Stars’ Create Value? Evidence from Their Daily Trades”, Russell Jame uses transaction-level data to investigate the magnitude and source of hedge fund equity trading profits. His sample includes name, equity trade dates (but not non-equity trades, if any), execution prices and transaction costs for 74 hedge funds and 579 other institutions over a 12-year period. He estimates performance by constructing buy and sell portfolios from trades and computing portfolio-level returns over intervals of the next 21, 63, 126 and 252 trading days (emphasizing 252 days as closest to the average holding period of a typical hedge fund). He excludes portfolios with fewer than ten stocks as too noisy. He considers gross return, gross DGTW-adjusted return (return on a stock less the value-weighted return on a benchmark portfolio with the same size, book-to-market and momentum characteristics as the stock) and net DGTW-adjusted return. Using detailed trading data as described during January 1999 through December 2010 and associated stock prices through December 2011, he finds that:
- Hedge funds generate a significant average gross monthly trading return of 0.52%, but the average gross (net) DGTW-adjusted monthly return is a statistically insignificant 0.42% (0.04%). Over longer holding periods, the average hedge fund return is not significantly different from zero.
- At a monthly horizon, the average trading performance of other institutions is similar to that of hedge funds. At longer horizons, other institutions trade less profitably than hedge funds.
- Bootstrap simulations indicate that luck cannot explain the annual performance of the top 10-30% of hedge funds. However, there is no evidence of star traders among other institutional investors.
- Moreover, hedge funds in the top 30% of past annual trading performance (stars) continue to outperform by 0.25% per month (3% per year) over the next year and by 0.19% per month over the next three years. There is no evidence that poorly performing hedge funds continue to underperform. There is no evidence of performance persistence for other institutional traders.
- Star hedge funds tend to be short-term contrarians (reversal traders) with small price impacts (patient traders). Their profits concentrate in relatively short holding intervals and more contrarian trades. More than 25% (50%) of their annual outperformance occurs within the first month (quarter) after trades.
- Performance persistence is significantly stronger for contrarian funds with small price impacts, and is absent for funds that follow momentum strategies or have large price impacts.
- Star hedge funds tend to:
- Have lockups and relatively long restriction periods.
- Be net buyers of growth stocks.
- Star hedge funds tend not to:
- Trade more frequently.
- Trade more profitably prior to earnings announcements.
- Focus on small, value or illiquid stocks.
- Take unusual left-tail risk.
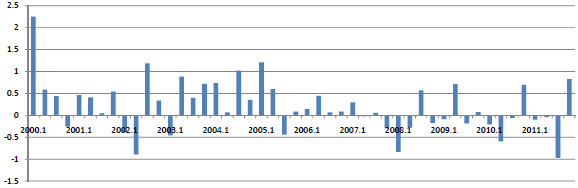
The following chart, taken from the paper, shows average net DGTW-adjusted monthly percentage returns of star (top 30%) hedge funds by quarter over the year after trades during 2000-2011. While star hedge funds earn significant trading profits, evidence suggests that hedge fund profits decline over time.
In summary, evidence suggest that star hedge funds profit by both buying and selling temporarily illiquid securities at favorable prices from investors who demand immediacy.
Cautions regarding findings include:
- As noted in the paper, the hedge fund sample is limited and potentially not representative of the entire universe of hedge funds.
- As noted above, profitability of even star hedge funds declines over the sample period, perhaps due to elevated competition for alpha.
Frequently Asked Questions
What is a hedge fund 'star' and how is it defined in trading performance studies?
A hedge fund 'star' is a fund in the top 30% of past annual equity trading performance. In Russell Jame's study of 74 hedge funds from 1999-2010, these funds were identified using transaction-level trade data and were tested for whether their outperformance persisted beyond luck.
Do top-performing hedge funds continue to outperform after their winning streaks?
Yes, top-performing hedge funds (the top 30% by past annual trading performance) continued to outperform by 0.25% per month (about 3% per year) over the next year and 0.19% per month over the next three years. Bootstrap simulations indicate luck cannot explain the annual performance of the top 10-30% of funds. Poorly performing hedge funds showed no evidence of continued underperformance, and other institutional investors showed no performance persistence.
How is hedge fund trading skill measured using daily trade data?
Hedge fund trading skill is measured by building buy and sell portfolios from transaction-level trades and computing portfolio returns over the next 21, 63, 126 and 252 trading days, emphasizing 252 days. Returns are measured gross, gross DGTW-adjusted (relative to a benchmark matched on size, book-to-market and momentum) and net DGTW-adjusted. Portfolios with fewer than ten stocks are excluded as too noisy.
How does contrarian trading compare to momentum trading for hedge fund performance?
Contrarian trading, particularly with small price impact (patient trading), was linked to star hedge fund performance persistence, while persistence was absent for funds following momentum strategies or having large price impacts. Star funds tend to be short-term reversal traders, with more than 25% of annual outperformance occurring in the first month and over 50% within the first quarter after trades. The evidence suggests they profit by trading temporarily illiquid securities at favorable prices from investors demanding immediacy.
What are the limitations of studies showing hedge fund managers can generate persistent trading alpha?
The hedge fund sample of 74 funds is limited and may not represent the entire hedge fund universe. Profitability of even star hedge funds declined over the sample period, perhaps due to elevated competition for alpha. Also, the data cover only equity trades, not any non-equity trades, and the average hedge fund's net DGTW-adjusted monthly return was only a statistically insignificant 0.04%.