Do individual investors truly benefit from using full service brokers? In the February 2011 draft of their paper entitled “What is the Impact of Financial Advisors on Retirement Portfolio Choices and Outcomes?”, John Chalmers and Jonathan Reuter compare outcomes for those Oregon University System’s Optional Retirement Plan participants who choose a firm that uses brokers to provide personal face-to-face financial services (HIGH level of service) and participants who choose the most popular lower-service firm (LOW level of service). Using demographic and monthly/annual account-level data from earliest availability (mostly 1997 or 1998) through 2009, they find that:
- Younger, less educated and lower paid employees are more likely to select the HIGH level of service.
- During 1999-2009, the typical plan participant realizes an average annual net return of 1.6%, compared to 3.0% for the S&P 500 Index. The typical LOW (HIGH) participant realizes an average annual net return of 2.1% (0.9%), with the difference roughly equal to the HIGH broker advisory fee.
- HIGH participants tend to have a higher exposure to the U.S. stock market than LOW participants, with average market beta 0.77 versus 0.59 (see the chart below).
- Controlling for asset class allocations and four-factor (market, size, book-to-market, momentum) risks, the average annual net alpha of LOW participants is more than 2% higher than that of HIGH participants.
- HIGH participants on average hold more funds than LOW participants (5.8 versus 3.6). They allocate significantly more to domestic equity funds (60% versus 41%) and to index funds (20% versus 8.1%) and less to fixed annuities, money markets and bonds. They are less likely to remain fully invested in the default investment option (2.0% versus 9.2%).
- HIGH participants are just as likely as LOW participants to engage in return chasing when allocating initial contributions, but neither group subsequently reacts much to returns.
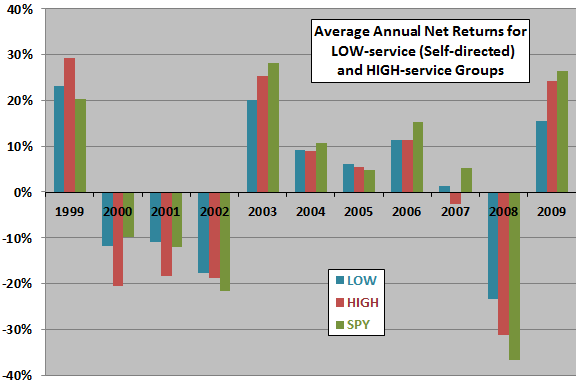
The following chart, constructed from data in the paper, compares average participant raw net annual return (after broker advisory fees, but with no adjustments for portfolio risk factors) for the self-selected LOW and HIGH participant groups. For reference, the chart includes annual returns for dividend-adjusted S&P Depository Receipts (SPY). Results show that the average annual experience of LOW participants is less volatile than that of HIGH participants. Over the entire sample period, individuals in the LOW (HIGH) group realize an average annual net return of 2.1% (0.9%). Four-factor risk adjustment widens this performance gap to over 2%.
The years 2000 and 2001 appear decisive to HIGH group underperformance relative to the LOW group and to the market, suggesting heavy exposure to technology in HIGH portfolios. If a relatively long-term phenomenon such as the technology bubble is important to the HIGH-LOW performance difference, an 11-year sample may be short for inference.

The authors note that:
- Factors other than quality of advice, such as differences in available investment options, may explain the performance gap between LOW and HIGH groups.
- Results do not demonstrate that HIGH participants would have done better by managing their own portfolios.
In summary, evidence suggests that the costs of full-service brokers may exceed the benefits, or at least that full-service brokers “are a costly and imperfect substitute for financial literacy.”
As noted above, an 11-year sample may be too short for understanding differences between advised and self-directed investor performances.