A subscriber suggested an alternative to the “Simple Asset Class ETF Momentum Strategy” that weights asset class ETFs according to five-month past return ranking (such as 35-25-20-10-4-3-2-1) rather than allocating all funds to the winner. Do the diversification benefits of this alternative outweigh the loss of momentum purity? To investigate, we return to the following eight asset class exchange-traded funds (ETF), plus cash:
PowerShares DB Commodity Index Tracking (DBC)
iShares MSCI Emerging Markets Index (EEM)
iShares MSCI EAFE Index (EFA)
SPDR Gold Shares (GLD)
iShares Russell 1000 Index (IWB)
iShares Russell 2000 Index (IWM)
SPDR Dow Jones REIT (RWR)
iShares Barclays 20+ Year Treasury Bond (TLT)
3-month Treasury bills (Cash)
As one benchmark, we allocate all funds at the end of each month to the asset class ETF or cash with the highest total return over the past five months (5-1). As another benchmark, we maintain an equal-weighted (EW), monthly rebalanced portfolio of all nine asset classes. As alternatives, we test two momentum rank-weighted (RW), linearly-scaled combinations of all nine classes, one steep across ranks and one shallow. We also test EW combinations of the Top 5, Top 4, Top 3 and Top 2 momentum ranks. Using monthly adjusted closing prices for the asset class proxies and the yield for Cash over the period February 2006 (the earliest all ETFs are available) through May 2014 (100 months), we find that:
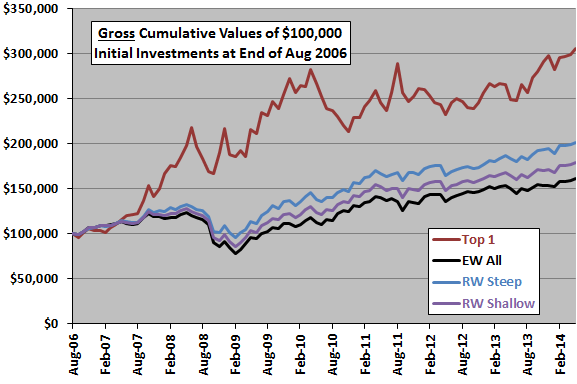
The following chart compares the gross cumulative values of $100,000 initial investments in the 5-1 and EW benchmarks and the steep and shallow RW alternatives. Calculations derive from the following assumptions:
- The weightings across performance ranks 1 through 9 for the steep RW alternative are 20%,18%,16%,13%,11%,9%,7%,4%,2%.
- The weightings across performance ranks 1 through 9 for the shallow RW alternative are 15%,14%,13%,12%,11%,10%,9%,8%,7%.
- Reallocate/rebalance at the close on the last trading day of each month (assume that total five-month past returns for the ETFs can be calculated just before the close).
- Assume no trading frictions and no tax implications of trading (discussion below).
Gross average monthly returns and standard deviations of monthly returns are:
- 5-1 (Top 1): 1.38% and 5.83%, with reward-to-risk ratio 0.24.
- EW All: 0.59% and 3.84%, with reward-to-risk ratio 0.15.
- RW Steep: 0.82% and 3.50%, with reward-to-risk ratio 0.23.
- RW Shallow: 0.69% and 3.64%, with reward-to-risk ratio 0.19.
Results suggest that portfolios employing momentum rank weighting across all asset class ETFs enhance simple EW diversification, but they do not beat the 5-1 strategy. Note that monthly trading frictions for the EW and RW strategies would be materially higher than that for the 5-1 strategy, such that the performance gap with the latter would widen for net outcomes.
What about just diversifying across a few of the top momentum-ranked asset class ETFs?
The next chart compares the gross cumulative values of $100,000 initial investments in the 5-1 strategy and alternatives EW combinations of the Top 5, Top 4, Top 3 and Top 2 momentum ranks.
Gross average monthly returns and standard deviations of monthly returns are:
- Top 1: 1.38% and 5.83%, with risk-return ratio 0.24.
- EW Top 5: 0.88% and 3.57%, with risk-return ratio 0.25.
- EW Top 4: 1.04% and 3.57%, with risk-return ratio 0.29.
- EW Top 3: 1.28% and 3.64%, with risk-return ratio 0.35.
- EW Top 2: 1.34% and 4.39%, with risk-return ratio 0.31.
- EW All: 0.59% and 3.84%, with reward-to-risk ratio 0.15.
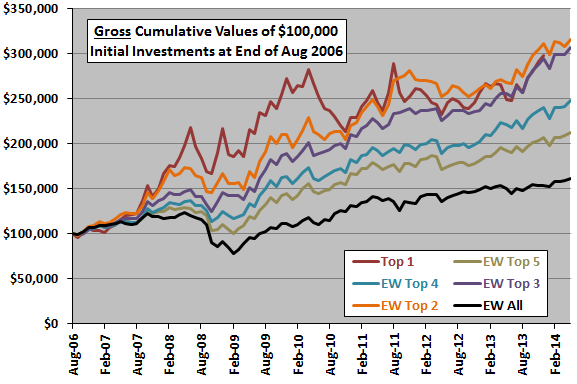
In summary, evidence from simple tests over a limited sample period of strategies that combine relative momentum and diversification support belief that minimally diversified strategies attractively reduce return volatility.
Cautions regarding findings include:
- Sample size is very small (just 19 independent five-month momentum ranking intervals).
- As noted, ignoring trading frictions gives an advantage to EW and RW strategies over 5-1, because the transaction costs would likely represent larger percentages of the smaller portfolio positions. Exact impact would depend on specific broker fees and portfolio size.