A reader asked: “If you have some thoughts on the claims in the article ‘The Capitalism Distribution’ by Blackstar Funds, LLC, I would be most interested in hearing them.”
“The Capitalism Distribution” examines returns for about 8,000 “stocks that would have qualified for membership in the Russell 3000 Index at some point in their lifetime” over the period 1983-2006, finding that (with dividends reinvested):
- 39% of these stocks were unprofitable.
- 18.5% lost at least 75% of their value.
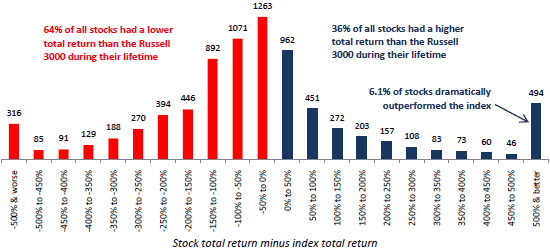
- 64% underperformed the capitalization-weighted Russell 3000 Index (see the chart below). “…market capitalization weighted indexation is like a simple trend-following system that rewards success and punishes failure.”
- 25% accounted for all of the Russell 3000 Index gains.
The following chart, taken from the paper, shows the distribution of total returns for individual stocks during their lifetimes relative to the return for the Russell 3000 Index over the same intervals during 1983-2006.

The principal conclusion of the paper is: “…the biggest winners on annualized return and total return basis tended to have one thing in common while they were accumulating market beating gains. Relative to average stocks they spent a disproportionate amount of time making new multi-year highs… Stocks that generate thousands of percent returns will typically hit new highs hundreds of times, usually over the course of many years. Could it be this simple; long term trend following on stocks?”
Some observations:
- Their principal conclusion seems tautological. The leap from past multi-year highs to future performance is not obvious. The findings in the final table of the paper regarding stock performance “On the way up” and “After the peak” are ex post. One needs ex ante analysis to assess exploitability (such as “Mutual Fund Momentum Measure Fly-off”, “Trading After 52-week Highs and Lows”, “Trading After N-day Highs and Lows” and “The 52-Week High as a Momentum Indicator for Individual Stocks”).
- How realistic and pivotal is the assumption of dividend reinvestment for long-run returns of both indexes and a broad sample of individual stocks? (See the first bullet in “One Up on the Fed Model?”.) In other words, if investors took dividends as cash instead of more stock, how would the distribution of returns change? Might some investors hold low performers to collect high cash dividends? For such a macro study, the broad reinvestment assumption might overstate the performances of indexes and winners and understate the performances of losers over the long run.
- What is the effect of comparing stock performances over different intervals within the overall sample period? As the authors note, the shorter average lifetime of losers compared to winners potentially distorts aggregate results by cycling losers through the sample faster than winners.
- Would results be different for periods other than 1983-2006?
Blackstar Funds, LLC has a follow-up paper on exploiting stock long-term price highs entitled “Does Trend Following Work on Stocks?”. In this analysis, the authors base position entry on “all-time highest close” and position exit on “average true range trailing stops.” They apply round-trip trading friction of 0.5% (arguably low for individuals attempting to hold a diversified portfolio), with results as follows:
- Win rate is 49.3%.
- Ratio of average winning trade return to average losing trade return is 2.56.
- Weighted average of the trade results distribution is about 15.2%, with average holding period 305 calendar days.
- Portfolio-level analysis over 1991-2008 generates an annualized return of 15.5% with standard deviation of annual returns 15.6% and maximum drawdown -29.3% (compared to 7.9% / 14.3% / -44.9% for the S&P 500 Index).
Both papers are empirical, not addressing either behavioral or risk-based momentum theory.