Is there strong evidence for price momentum within and across all major asset classes over the long run? In the May 2015 version of their paper entitled “215 Years of Global Multi-Asset Momentum: 1800-2014 (Equities, Sectors, Currencies, Bonds, Commodities and Stocks)”, Christopher Geczy and Mikhail Samonov examine the momentum effect for very long price histories within and across major asset class universes consisting of: 47 country equity markets; 301 global equity sectors; 43 government bond series; 76 commodities; 48 currencies; and, 34,795 U.S. stocks. Their baseline momentum metric is return from 12 months ago to two months ago, with two skipped months to avoid any short-term reversal, followed by a one-month holding interval. Their baseline momentum portfolio is long (short) the third of assets with highest (lowest) momentum, equally weighted and reformed monthly. Their benchmarks are the equally weighted returns of all assets in the universes. Using monthly price data for the specified assets as available during 1800 through 2014 (215 years), they find that:
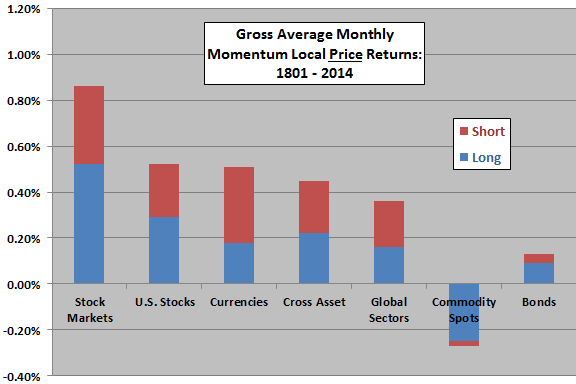
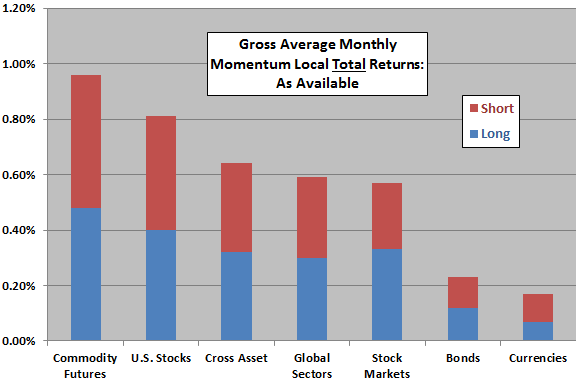
- Over the entire sample period, the momentum effect is significant on a gross basis within all asset classes except commodity spot prices, and across asset classes (see the first two charts below).
- Commodity spot prices exhibit reversion rather than momentum. Later introduction of commodity futures dampens or eliminates reversion in associated spot prices.
- Within other asset classes, average monthly long-short momentum portfolio gross return is largest within country equity markets (0.88% per month) and smallest within country bond series (0.13% per month).
- A strategy that is long (short) the two of country equities, bonds, currencies and inverse commodities with the highest (lowest) past returns, each calculated as the simple average of intra-class asset returns, generates an average monthly gross return of 0.45%.
- Long and short side contributions to long-short momentum portfolio gross returns are roughly equal.
- However, numerous 10-year intervals when long-short momentum portfolio returns are negative indicates strategy risk. Such intervals are more frequent before 1950, suggesting that recent data may underestimate this risk.
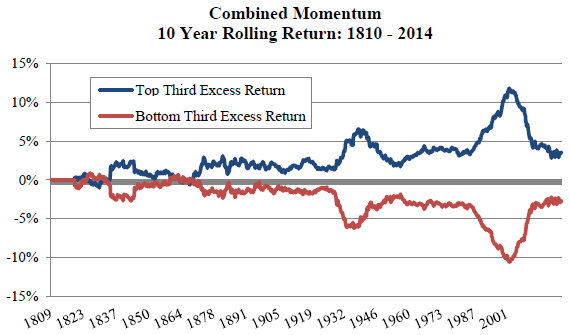
- The strength of the momentum effect varies considerably over time (see the third chart below). The longer an up or down market state persists, the larger the momentum effect.
- During the two skip months, only U.S. stocks exhibit short-term reversal (in other words, skip-months for asset class proxies may be counterproductive). All assets exhibit long-term reversion over holding intervals of 36 months.
- Over the long run, momentum return series among asset classes exhibit low correlations. However, correlations have recently risen significantly.
The following two charts, constructed from data in the paper, summarize average monthly momentum portfolio gross return as the sum of two components:
Short – average underperformance of the assets in the short side of the momentum portfolio relative to the equally weighted average return of assets in the specified class.
Long – average outperformance of the assets in the long side of the momentum portfolio relative to the equally weighted average return of assets in the specified class. For a long-only investor, this contribution therefore indicates outperformance of the equally weighted market.
The upper chart employs local asset prices only (ignoring dividends/interest and exchange rates) and uses commodity spot prices over the entire 1801-2014 sample period. It supports belief in a momentum effect, on a gross basis, in all classes except commodities.
The lower chart includes dividends/interest to calculate local total returns and uses commodity futures (rather than spot) prices over shorter sample periods. It supports belief in a momentum effect, on a gross basis, in all classes. Note that commodity futures behave very differently from commodity spots.
The next chart, taken from the paper, plots 10-year rolling annualized average gross returns of the seven momentum return time series in the first chart above (with commodity spot returns inverted). “Top Third Excess Return” corresponds to “Long” above, and “Bottom Third Excess Return” corresponds to “Short” above.
Results generally support belief that momentum is pervasive (except for commodity spot prices), much more so during the second half of the long sample period. However, there are extended subperiods when combined momentum does not perform well (when the two series converge).
In summary, evidence from long-run data across multiple asset classes generally support belief in asset class return momentum on a gross (frictionless) basis.
Cautions regarding findings include:
- The number of price series available in some asset classes is small early in the sample period.
- Assembling long-run price series requires assumptions which may affect findings.
- All but one of the asset classes are essentially indexes rather than tradable assets. The costs of setting up and maintaining tracking funds for these indexes, and the costs of monthly switching among them would reduce reported returns. Moreover:
- Fund maintenance and switching costs may have been very high for a large part of the sample period (see “Trading Frictions Over the Long Run”).
- If tracking funds had existed, market feedback from trading them may have affected their behaviors.
- Since costs may vary by country and asset class, findings based on tradable assets may differ from those based on indexes with frictionless portfolio reformation.
- Short sides contribute materially to long-short momentum portfolio outperformance. Costs of shorting would reduce performance, and shorting may not have been feasible for some assets.
See the related “Stock Price Momentum Over the Very Long Run”.