“Sticky Winner Asset Class ETF Momentum Strategy” tests whether limiting the trading of the “Simple Asset Class ETF Momentum Strategy” by holding onto the winner until it drops out of the top three boosts performance of the latter by reducing trading and thereby suppressing trading frictions. A subscriber proposed a more precise approach to limit trading: continue holding a past winner until it loses to a new winner by a significant margin. To investigate whether this approach (Buffered Winner) works, we compare it to the original strategy (Winner), which allocates all funds at the end of each month to the asset class exchange-traded fund (ETF) or cash with the highest total return over the last five months, as applied to the following nine assets:
PowerShares DB Commodity Index Tracking (DBC)
iShares MSCI Emerging Markets Index (EEM)
iShares MSCI EAFE Index (EFA)
SPDR Gold Shares (GLD)
iShares Russell 1000 Index (IWB)
iShares Russell 2000 Index (IWM)
SPDR Dow Jones REIT (RWR)
iShares Barclays 20+ Year Treasury Bond (TLT)
3-month Treasury bills (Cash)
Using monthly adjusted closing prices for the asset class proxies and the yield for Cash over the period July 2002 (or inception if not available then) through June 2014 (144 months), we find that:
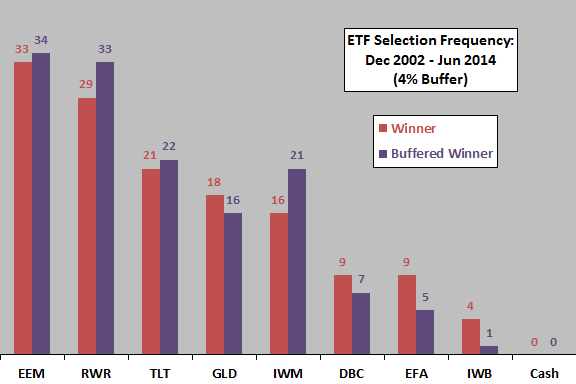
The following chart compares distributions of asset class ETF winners for the Winner and Buffered Winner strategies over the entire sample period, with the buffer set at 4% (continue holding a past winner until its total return over the last five months is at least 4% lower than that for the current winner). Note that number of ETFs in competition increases over time, as follows:
- EFA, IWB, IWM, RWR and TLT are available over the entire sample period.
- EEM is available starting April 2003.
- GLD is available starting November 2004.
- DBC is available starting February 2006.
Results suggest that the Buffered Winner alternative may tilt toward risky equities compared to the Winner strategy.
How do the strategies translate into portfolio outcomes?
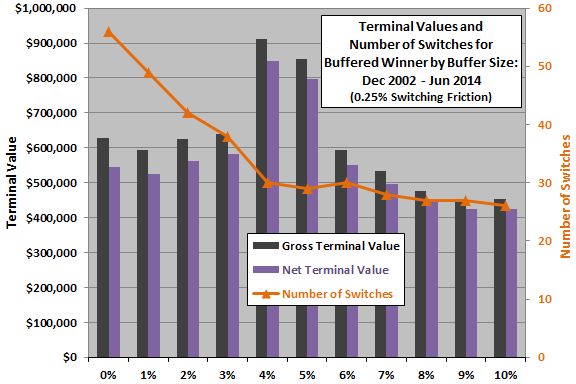
The next chart compares terminal values of $100,000 initial investments in the Buffered Winner strategy for buffer sizes ranging from 0% (the base Winner case) to 10%. Calculations derive from the following assumptions:
- Reallocate/rebalance at the close on the last trading day of each month (assume that total five-month past returns for the ETFs can be calculated just before the close).
- For net values, trading (switching) friction is 0.25% of the balance whenever there is a change in holdings.
- Ignore any tax implications of trading.
Results indicate that a buffer on past return measurement does suppress switching, most effectively for buffers up to 4%. The 4% and 5% buffers are optimal for terminal value, due mostly to differences in asset selection rather than suppression of switching frictions. Other buffer sizes have little effect (but reduced switching may be meaningful tax-wise).
The sharpness of the improvement in terminal values for buffers of 4% and 5% suggest luck in asset selection rather than some fundamental importance of the buffer size.
For deeper perspective we compare net cumulative performances for different buffer sizes.
The final chart compares net cumulative values for the Buffered Winner strategy across the range of buffer sizes used above. The heavy black line corresponds to a buffer of 0% (the base Winner case). The two outperforming cases correspond to buffers of 4% and 5%, with outperformance of both relative to the base Winner case concentrating in 2010.
The 4% Buffered Winner case outperforms (underperforms) the Winner case during 18% (11%) of months. There are seven (three) months during which the 4% Buffered Winner case outperforms (underperforms) the base Winner case by at least 4%.
To the extent that there is some fundamentally/persistently superior (not just lucky) buffer size, an investor would prefer a 4% or 5% buffer. Concentration of outperformance in a few months suggests luck.

In summary, evidence from a limited sample period and simple tests offers a little support for belief that holding onto a past winner until a new winner beats it by some margin can improve performance of the Simple Asset Class ETF Momentum Strategy.
Cautions regarding findings include:
- As noted, sample size is modest (about 29 independent five-month momentum ranking intervals for five ETFs and fewer for three others).
- As noted, buffer size optimization introduces data snooping bias, which is especially pernicious for small samples. Concentration of outperformance for optimal buffer sizes and lack of systematic variation of performance across buffer sizes undermine belief that differences in performance are fundamental rather than lucky.
- The Buffered Winner tilt toward risky equities may be harmful at the onset of equity bear markets.