A subscriber inquired whether the level of momentum (past return) for each asset in the “Momentum Strategy” indicates the level of future return for that asset, and whether extreme negative momentum supports shorting an asset. In other words, do each of these asset class proxies exhibit reliably exploitable intrinsic momentum? To investigate, we regress next-month return versus past five-month return for each of the following eight asset class exchange-traded funds (ETF):
PowerShares DB Commodity Index Tracking (DBC)
iShares MSCI Emerging Markets Index (EEM)
iShares MSCI EAFE Index (EFA)
SPDR Gold Shares (GLD)
iShares Russell 1000 Index (IWB)
iShares Russell 2000 Index (IWM)
SPDR Dow Jones REIT (RWR)
iShares Barclays 20+ Year Treasury Bond (TLT)
Using monthly dividend-adjusted closing prices for the asset class proxies over the period July 2002 (or inception if not available then) through June 2013 (maximum 132 months), we find that:
The following table summarizes Pearson correlations between next-month return and past five-month return for each of the eight asset class proxies. Results suggest that intrinsic momentum may have some value for DBC, EFA, IWB, RWR and EEM, but not for IWM, GLD or TLT. For TLT, use of intrinsic momentum may be harmful.
Samples are small due to overlapping past return measurements, so confidence in these findings is low.
For greater insight, we construct the scatter plot associated with each correlation.
![]()
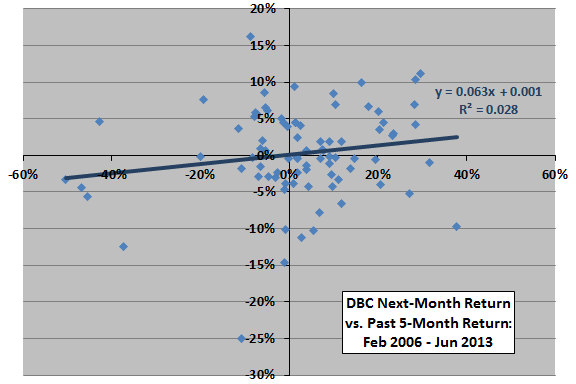
The following scatter plot relates next-month return for DBC to its return over the past five months. The slope of a best-fit line is positive, so higher (lower) past return indicates a tendency for higher (lower) future return. The R-squared statistic indicates that past return explains only about 3% of the variation in next-month return. The formula for this line suggests that expected next-month return is negative when past five-month return is less than about -2%. Volatility of next-month return does not appear to vary with past return.
The predictive relationship is weak and of low confidence, so trading on intrinsic momentum would be very risky.
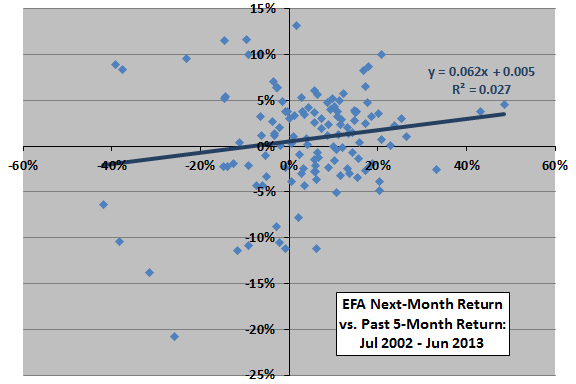
The next scatter plot relates next-month return for EFA to its return over the past five months. The slope of a best-fit line is again positive. The R-squared statistic indicates that past return explains only about 3% of the variation in next-month return. The formula for this line suggests that expected next-month return is negative when past five-month return is less than about -8%. Volatility of next-month return is higher for low past returns than high past returns.
The predictive relationship is again weak and of low confidence. However, in addition to a small edge in return, trading on intrinsic momentum may avoid high next-month volatility.
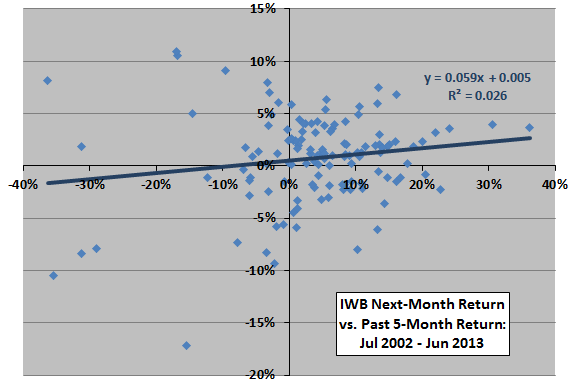
The next scatter plot relates next-month return for IWB to its return over the past five months. Findings are very similar to those for EFA above. The formula for this line suggests that expected next-month return is negative when past five-month return is less than about -8%.
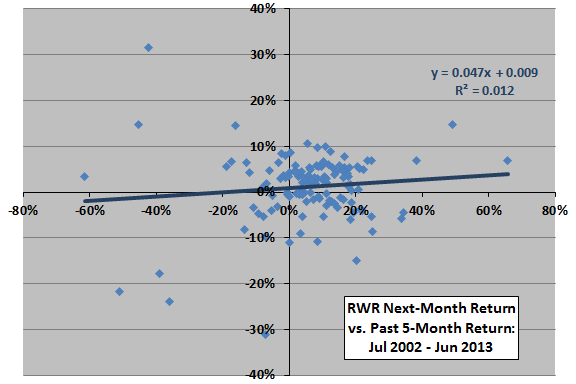
The next scatter plot relates next-month return for RWR to its return over the past five months. Findings are similar to those for EFA and IWB above. The formula for this line suggests that expected next-month return is negative when past five-month return is less than about -19%.
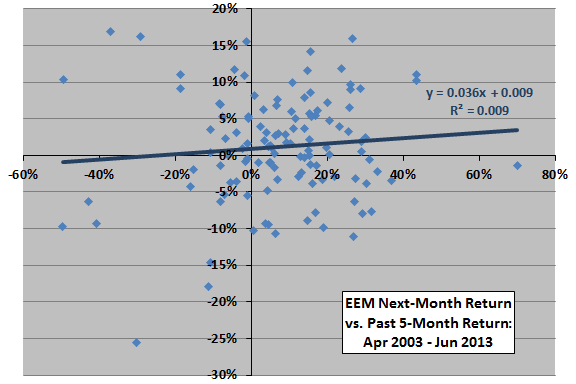
The next scatter plot relates next-month return for EEM to its return over the past five months. Findings are similar to, but weaker than, those for EFA above. The R-squared statistic indicates that past return explains only about 1% of variation in next-month return. The formula for the best-fit line suggests that expected next-month return is negative when past five-month return is less than about -25%.
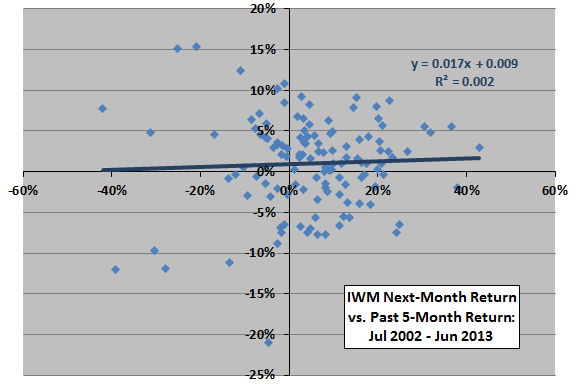
The next scatter plot relates next-month return for IWM to its return over the past five months. The best-fit line is fairly flat, and the R-squared statistic indicates that past return explains practically none of the variation in next-month return. The formula for the best-fit line does not suggest any practical past-return threshold for shorting.
While return predictability is absent, low past returns indicate high next-month return volatility (as for the other equity ETFs), so intrinsic momentum may have some volatility-avoidance value.
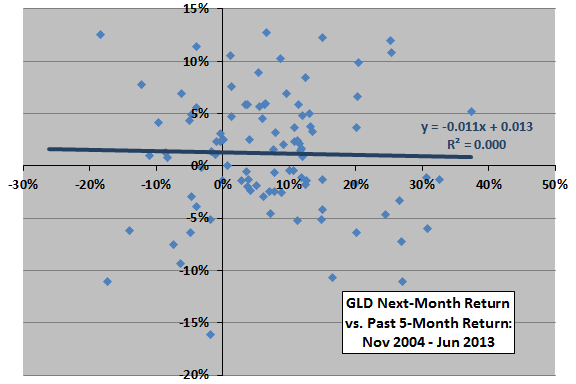
The next scatter plot relates next-month return for GLD to its return over the past five months. The best-fit line is fairly flat, and the R-squared statistic indicates that past return explains none of the variation in next-month return. Nor is past return informative about future volatility. Intrinsic momentum apparently does not exist for GLD.
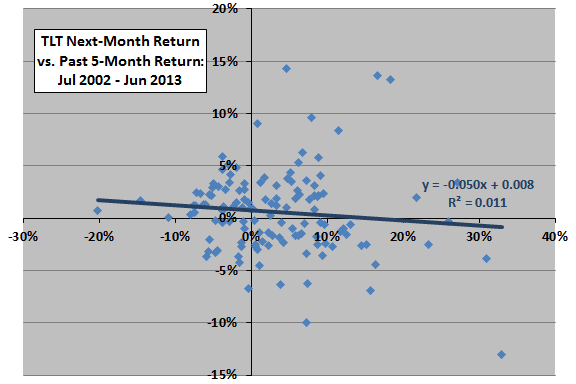
The final scatter plot relates next-month return for TLT to its return over the past five months. The slope of a best-fit line is negative, so higher (lower) past return indicates a tendency for lower (higher) future return. The R-squared statistic indicates that past return explains only about 1% of the variation in next-month return. The formula for this line suggests that expected next-month return is negative when past five-month return is greater than about 16%. It appears that volatility of next-month returns may be higher after high than low past returns.
While indications are weak and sample size is small, if anything, TLT exhibits intrinsic reversion rather than intrinsic momentum.
In summary, evidence weakly suggests that intrinsic momentum may have a little value for some assets (some equities, real estate, commodities) based on future return enhancement and/or future volatility avoidance, but not for other assets (government bonds and gold).
Cautions regarding findings include:
- Sample size is not large in terms of number of independent 5-month return measurement intervals (only 26 for most assets and as few as 18 for others).
- The above analyses are in-sample. An investor operating in real time during the sample period would likely generate different findings at different points in time. Due to relatively weak indications that vary by asset class and small samples, realistic (out-of-sample) trading strategy tests are problematic. Trading frictions and shorting costs would inhibit exploitation of any predictive power.
- The 5-month past return interval is optimized and may include material data snooping bias. Moreover, testing the same intrinsic momentum concept on many assets introduces a second level of snooping, such that the strongest relationships may overstate.
See the first chart in “Simple Asset Class ETF Momentum Strategy Robustness/Sensitivity Tests”, which indicates that shorting the lowest of the nine momentum rankings each month is problematic. See also various relevant analyses via a search on “intrinsic momentum”, which generally apply thresholds (rather than continuous gradation) to test the usefulness of intrinsic momentum.