Does intricate optimization of the relationship between past month-by-month returns and future month-by-month returns substantially outperform a simple stock return momentum strategy based on some fixed past return interval? In their March 2016 paper entitled “Tree-Based Conditional Portfolio Sorts: The Relation between Past and Future Stock Returns”, Benjamin Moritz and Tom Zimmermann apply the machine learning concept of tree-based conditional portfolio sorts to determine which past monthly stock returns provide independent information about future monthly returns. This methodology handles a large number of independent variables, exposes non-linear relationships and emphasizes systematic out-of-sample testing. Their solution (“intricate” momentum) is an average model that smooths potentially anomalous predictions of many specific models, each employing different subsets of predictive variables on different subsamples (to mitigate overfitting). They make intricate momentum adaptive by annually updating the average model based on the last five years of data to determine how each of the monthly returns during the last 24 months predict each of the monthly returns over the next 12 months, generating a total of 45 annual predictions commencing five years after the start of the sample. Their test portfolio takes equally weighted long (short) positions in the tenth of stocks with the highest (lowest) predicted returns during each of these 12 months. Using monthly returns and stock/firm characteristics for a broad sample of U.S. stocks during 1963 through 2013, they find that:
- In general:
- Past returns predict future returns in a more complex way than any fixed past interval return can capture.
- Recent monthly returns (the past six months) contain nearly all the predictive information about future returns.
- Some of the predictive relationships between past monthly returns (mostly those from two to four months ago) and future returns are non-linear. For example, both high and low returns two months ago predict low future returns.
- Many past monthly returns interact in predicting future returns. For example, the return two months ago relates positively (negatively) to future returns for stocks with low (high) returns last month.
- Over the entire sample period, the long-short test portfolio described above:
- Has 2.3% average gross raw monthly return, mostly coming from the long side (see the first chart below).
- Has 2.0% gross monthly four-factor (adjusting for market, size, book-to-market and momentum factors) alpha, coming mostly from the short side.
- Generates a positive gross annual return all 45 prediction years, although performance is weaker in recent years (see the second chart below).
- Detects changes in relationships between past and future returns during the 2008-2009 financial crisis, such that test portfolio positions become opposite those of a conventional momentum strategy.
- Generates high turnover (on average about 80% of the stocks in extreme deciles change each month) and is stronger in small-capitalization stocks and strongest in microcap stocks, but still produces 24% annual excess return after accounting for estimated trading frictions.
- Is largely unaffected by including 86 additional firm characteristics in the sorting process.
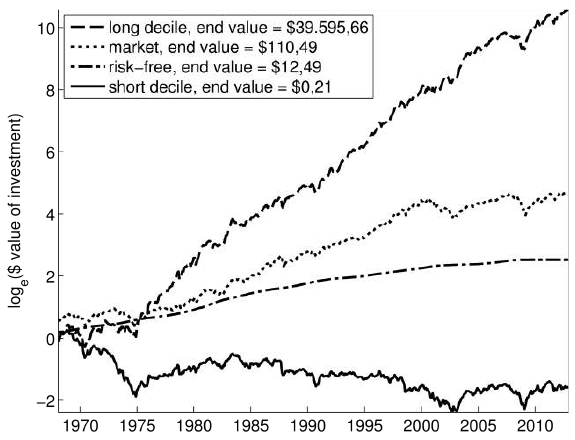
The following chart, taken from the paper, compares gross cumulative profit over the entire sample period from investing $1 at the end of 1968 in each of the following four strategies:
- Buy each month the long side of the test portfolio described above.
- Buy and hold the broad U.S. stock market.
- Buy and hold the risk-free asset (per Kenneth French’s data library).
- Buy each month the short side of the test portfolio described above.
Results show that test portfolio long and short sides both contribute to portfolio gross return, but the former dominates over the long run.
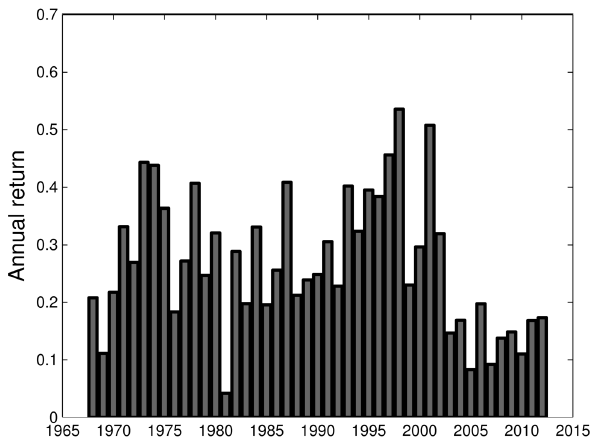
The next chart, also from the paper, summarizes gross annual returns for the test portfolio described above over the entire sample period. Each year corresponds to an out-of-sample test of one return prediction iteration. Each of the 45 predictions generates a positive annual return, although returns are relatively weak over the last ten years of the sample period.
In summary, evidence indicates that investors can substantially improve a stock return momentum strategy by intricately and dynamically relating monthly returns over each of the past 24 months to monthly returns over each of the next 12 months.
Cautions regarding findings include:
- Large data collection/processing requirements may have made timely reformation of the test portfolio infeasible over some of the sample period. However, the authors report that findings are robust to a one-day implementation delay.
- The sorting process is beyond the reach of many investors, who would bear fees for delegating it to an investment advisor/manager.
- As noted, test portfolio performance is relatively weak over the last decade of the sample (when the strategy is most feasible).
- The paper provides little detail on estimation of trading frictions. These estimates may be too low generally for parts of the sample period and specifically for some investors. Also, calculations ignore costs of shorting, which would reduce test portfolio performance. Shorting of some stocks with the lowest expected returns may not be feasible.
- The five-year lookback interval selected to determine annual average models may impound data snooping bias. Moreover, the authors may have run the entire 45-year prediction set multiple times in exploring the methodology, thereby limiting the value of annual out-of-sample testing.