Do global equity market behaviors support the hypothesis that intermediate-term momentum drives stock prices beyond fundamental values, thereafter driving long-term reversion? In their June 2016 paper entitled “Overreaction and the Cross-Section of Returns: International Evidence”, Douglas Blackburn and Nusret Cakici investigate whether long-term reversion is evident in global equity markets allocated to four regions: North America, Europe, Japan and Asia. They define long-term (LT) stock return as cumulative return over the last three years. They define momentum, or short-term (ST) stock return, as return from 12 months ago to one month ago. They measure LT and ST return effects in each region based on average monthly returns of hedge portfolios that are each month long (short) the equal-weighted or value-weighted ranked fifth (quintile) of stocks with highest (lowest) LT or ST returns. They designate these portfolios winners-minus-losers (WML). They examine a size effect by calculating hedge portfolio returns separately for big stocks (the largest stocks, comprising 90% of market capitalization) and small stocks (the rest) within each region. They test interactions of LT reversion with each of ST momentum, book-to-market ratio and size via hedge portfolios constructed from independent double sorts. Using monthly excess returns (in U.S. dollars relative to the U.S. Treasury bill yield) and characteristics for all stocks in the MSCI World Index, past and present, encompassing 23 developed equity markets during 1993 through 2014, they find that:
- Based on equal weighting, three of four regions exhibit significant LT reversion effects. Average gross monthly returns for LT-WML portfolios in North America, Japan and Asia are -0.80%, -1.03% and -0.54%, respectively. Corresponding gross monthly four-factor (market, size, book-to-market and momentum) alphas are -0.84%, -0.75% and -0.91%. Europe does not exhibit a LT reversion effect.
- Based on value weighting, average gross monthly returns for LT-WML portfolios are insignificant, suggesting an important role for size. Across all regions, no LT reversion effect is evident for big stocks.
- For all four regions, there is strong interaction between LT reversion and ST momentum. For the quintile of ST losers, the average gross monthly returns for LT-WML hedge portfolios are -1.88%, -1.18%, -2.00%, and -1.76% for North America, Europe, Japan and Asia, respectively. Also, ST-WML hedge portfolio returns are strongest within the quintile of LT winners (see the chart below).
- The LT reversion effect persists in North America, Japan and Asia after controlling for book-to-market, refuting the argument that overreaction drives the value premium.
- The LT reversion effect persists after controlling for all of size, book-to-market and momentum (suggesting a unique factor), but only among small stocks.
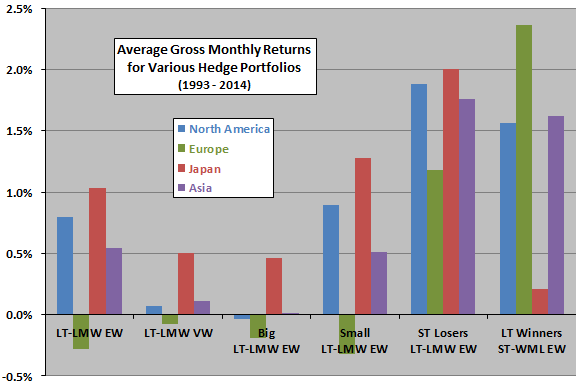
The following chart, constructed from data in the paper, compares average gross monthly returns by region for the following six hedge portfolios:
- LT-LMW EW – hedge portfolios that are each month long (short) the equally weighted quintile of stocks with the lowest (highest) long-term returns.
- LT-LMW VW – same as LT-LMW EW, but with value weighting of the extreme quintiles.
- Big LT-LMW EW – same as LT-LMW EW, but applied only to big stocks as defined above.
- Small LT-LMW EW -same as LT-LMW EW, but applied only to small stocks as defined above.
- ST Losers LT-LMW EW– same as LT-LMW EW, but applied only to short-term losers via an independent double sort.
- LT Winners ST-WML EW – hedge portfolios that are each month long (short) the equally weighted quintile of stocks with the highest (lowest) short-term returns, applied only to long-term winners via an independent double sort.
Note that the LT reversion portfolios here reverse WML to LMW to obtain positive returns. Results indicate that:
- There is a LT reversion effect in all regions except Europe.
- The LT reversion effect concentrates in small stocks.
- The LT reversion and ST momentum effects interact strongly.
In summary, evidence from developed market stocks worldwide indicates a widespread (but not ubiquitous) three-year reversion effect that interacts strongly with the momentum effect.
Cautions regarding findings include:
- The sample period is not long in terms of number of independent long-term return measurement intervals (only about seven independent three-year intervals).
- The study does not check whether, as for some other anomalies, the very unusual market conditions of 2008-2009 drive findings.
- Reported returns are gross, not net. Accounting for monthly portfolio reformation frictions and shorting costs for hedge portfolios would reduce returns. Moreover, these frictions/costs may vary considerably across global equity markets, and shorting may not always be feasible.
- Average monthly returns is not sufficient for evaluating strategy attractiveness. For example, the hedge portfolios may have large drawdowns.
- Testing many strategy variations on the same data introduces snooping bias, such that the best-performing variations incorporate luck and overstate expectations.