It is arguable that many stock momentum strategy tests derive more from logical/programming simplicity than common portfolio management practices. Does momentum work for portfolios of U.S. stocks when melded with the latter? In the January 2012 update of his paper entitled “Relative Strength and Portfolio Management”, John Lewis tests individual stock momentum in the context of real-world stock portfolio practices. After initial selection of top stocks, he replaces weakening stocks with strong ones as needed rather than at a fixed interval, depending on four parameters: (1) momentum ranking interval; (2) number of stocks in the portfolio; (3) buy rank threshold; and, (4) sell rank threshold. To test robustness, he conducts multiple trials based on random selection of stocks above the buy rank threshold. Specifically, he presents nine examples of 100 iterations of 50-stock portfolios randomly selected from the top 10% of the S&P 900 (S&P 500 large-cap plus S&P 400 mid-cap) based on momentum ranking intervals of one month to five years, replacing stocks when they fall out of the top 25%. Portfolios are apparently equally weighted at initial formation. Examples ignore dividends, management fees and trading frictions. Using daily returns (excluding dividends) for the S&P 900 stocks over the period 1996 through 2011 (16 years), he finds that:
- For the featured 12-month ranking interval over the entire sample period:
- Average (median) gross return for the 100 portfolio trials is 271% (257%), compared to a return of 104% for the S&P 500 Index (without dividends).
- The gross return for the worst trial is 125.9%, still beating the S&P 500 Index.
- During 1998, 1999, 2005 and 2010 (2006, 2008 and 2009), all (none) of the 100 trial portfolios beat the S&P 500 Index.
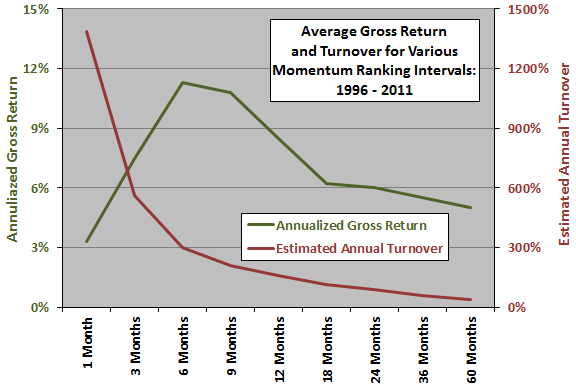
- For ranking intervals of three, six, nine and 12 months, all 100 trial portfolios beat the S&P 500 Index over the entire sample period, with average annualized gross returns of 7.5%, 11.3%, 10.8% and 8.5%, respectively, compared to 4.6% for the index.
- Average gross returns for portfolios formed using ranking intervals of one, 18, 24, 36 and 60 months are weaker due to material mean reversion (especially for the one-month ranking interval).
- Turnover escalates as ranking interval decreases, indicating a critical trade-off between responsiveness to trend change and trading friction for ranking intervals in the range of six to 12 months.
The following chart, representative of findings in the paper, compares the annualized average gross return and estimated average annual turnover of the individual stock momentum strategy described above by ranking interval. While a six-month ranking interval maximizes average gross return, a longer ranking interval with lower turnover may maximize average net return.

In summary, evidence from tests of individual stock momentum in a portfolio management context support belief that ranking intervals in the range six to 12 months outperform the S&P 500 Index over the past 16 years.
Cautions regarding findings include:
- As noted, return calculations are gross. Including realistic trading frictions would reduce returns materially, perhaps decisively for portfolios of modest value.
- Dividend yield for the top past return decile may tend to be relatively low, making exclusion of dividends from the benchmark advantageous to the momentum strategy.
- The value-weighted S&P 500 Index is arguably not the right benchmark to gauge the intrinsic value of a momentum strategy that weights equally (at least initially) stocks selected from the S&P 900. Equal weighting in itself incorporates a size effect, and momentum winners may skew toward the higher-performing stocks of the S&P 400. The equally weighted, occasionally rebalanced S&P 900 may be stiff competition for the average momentum portfolio. Buying and holding SPY (tracking the S&P 500 Index) and MDY (tracking the S&P 400 Index) with initial equal weights may be competitive. During 1996-2011, dividend-reinvested SPY and MDY generate total returns of 165% and 350%, respectively.