The model “Simple Asset Class ETF Momentum Strategy” (SACEMS) explores combinations of diversification and momentum as applied to exchange-traded fund (ETF) proxies for asset classes. As introduced, this strategy employed a baseline momentum ranking interval (six-month lagged ETF total return) to the following asset class ETFs, plus cash:
PowerShares DB Commodity Index Tracking (DBC)
iShares MSCI Emerging Markets Index (EEM)
iShares MSCI EAFE Index (EFA)
SPDR Gold Shares (GLD)
iShares Russell 1000 Index (IWB)
iShares Russell 2000 Index (IWM)
SPDR Dow Jones REIT (RWR)
iShares Barclays 20+ Year Treasury Bond (TLT)
3-month Treasury bills (Cash)
However, “Simple Asset Class ETF Momentum Strategy Robustness/Sensitivity Tests” shows that the six-month momentum ranking interval is not optimal in terms of average monthly return or cumulative return over the available sample period. With angst over data snooping bias, we are revising the model strategy by substituting an historically optimal momentum ranking interval. Using the SACEMS dataset from (data through August 2012) to compare performances of the baseline and optimal calculation intervals, we find that:
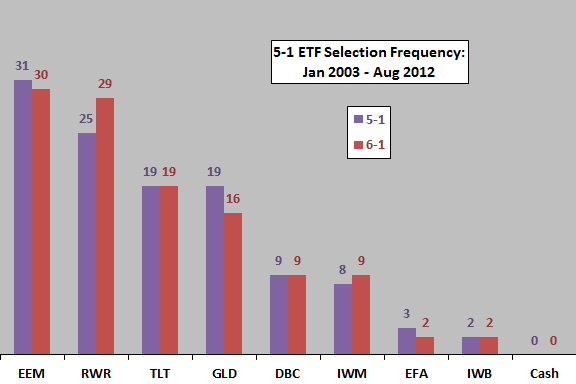
The following chart compares the distributions of winners for the baseline momentum strategy (6-1) that each month picks the ETF with the highest lagged six-month return and the optimal variation (5-1) based on picking each month the ETF with the highest lagged five-month return. The most noticeable differences are that the five-month ranking interval specified RWR fewer times and GLD more times.
How does these differences translate into cumulative return?

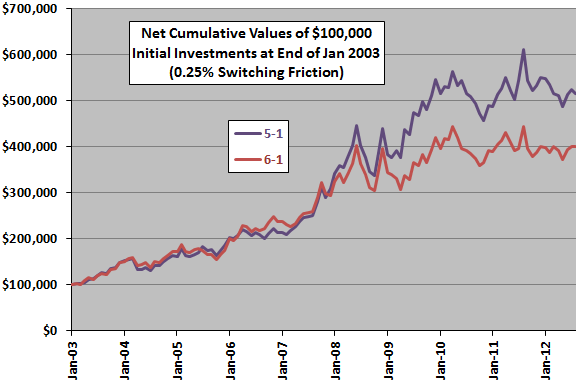
The next chart compares the net cumulative returns for the 5-1 and 6-1 strategy variations with trading friction set at 0.25% per ETF switch. Results suggest that the outperformance of the 5-1 variation concentrates during the financial crisis and immediate recovery. A possible explanation is that asset price trends compress around crises (in which case the mix of bull and bear market states affects the optimal momentum ranking interval).
Average net monthly return for the 5-1 (6-1) strategy variation is 1.63% (1.39%), with standard deviation 5.93% (5.92%).
How do the monthly return streams differ?

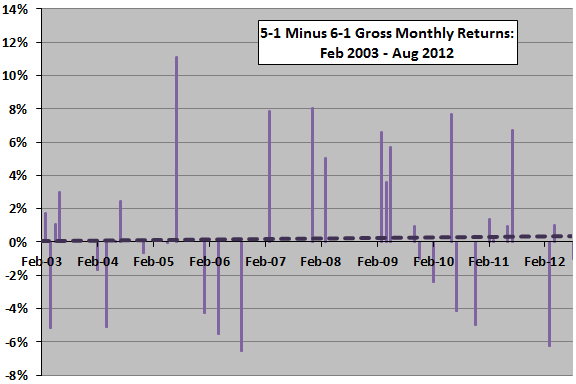
The final chart shows the month-by-month difference in gross returns between the 5-1 and 6-1 strategy variations. The heavy dashed line is the linear best-fit trend in differences, suggesting a weakly increasing difference over time. However, data are sparse for trend measurement.

In summary, evidence from simple tests suggests that a five-month momentum ranking interval may outperform the baseline six-month interval as applied to the selected set of asset class ETFs using available data.
We have therefore changed the model Momentum Strategy by replacing the six-month ranking interval with a five-month interval.
Cautions regarding findings include:
- As noted, optimizing introduces data snooping bias, such that the best alternative overstates future performance (but likely preserves the ranking of alternatives).
- Given the modest number of monthly differences and the volatility of those differences, confidence that the 5-1 and 6-1 strategies will continue to produce different outcomes is not high.