Does the return to momentum investing reliably reflect a reward for taking some risk? In the March 2014 version of her paper entitled “Asymmetric Risks of Momentum Strategies”, Victoria Dobrynskaya examines the performance of past winner and loser stocks, stock indexes and currency exchange rates during global equity market advances and declines. She focuses on the difference between downside and upside market betas (asymmetric beta) of momentum portfolios that are long past winners and short past losers (winner-minus-loser, or WML). She bases momentum rankings on total returns from 12 months ago to one month ago, with a month skipped before portfolio formation to avoid short-term reversal. She considers momentum portfolios formed from: a broad sample of U.S. stocks (January 1927 through July 2013): global and world regional stocks (November 1990 through August 2013); 40 country stock indexes (as they become available during January 1983 through August 2013); and, 45 currency exchange rates relative to the U.S. dollar (as they become available during October 1983 through August 2013). She also examines U.S. short-term reversal stock portfolios sorted by prior-month return (January 1927 through July 2013) and U.S. long-term reversal stock portfolios sorted by past five-year return (January 1931 through July 2013). She relies on Kenneth French’s data library for stock-level portfolio returns. Using total return data for the specified portfolios and for associated market indexes, she finds that:
- For the broad sample of U.S. stocks ranked into tenths by momentum, with the top tenth designated winners and the bottom tenth designated losers:
- The value-weighted (equal-weighted) WML portfolio generates a gross annualized return of 14.3% (9.8%).
- Winners (losers) have higher downside (upside) than upside (downside) market betas. WML portfolios therefore have substantially higher downside than upside market betas (see the chart below).
- For the sample of global stocks ranked into fifths by momentum, with the top fifth designated winners and the bottom fifth designated losers:
- The equal-weighted WML portfolio generates a gross annualized return of 11.1%.
- As for U.S. stocks, the WML portfolio has substantially higher downside than upside market beta.
- Results are similar for European, Asian-Pacific and North American regional subsets.
- For the sample of country stock indexes ranked into sixths by momentum, with the top sixth designated winners and the bottom sixth designated losers:
- The equal-weighted WML portfolio generates a gross annualized return of 12.9% in U.S. dollars.
- As for individual stocks, the WML portfolio has substantially higher downside than upside market beta.
- For the sample of currency exchange rates versus the U.S. dollar ranked into fifths by momentum, with the top fifth designated winners and the bottom fifth designated losers:
- The equal-weighted WML portfolio generates a gross annualized return of 7.8%.
- As for stocks, the WML portfolio has substantially higher downside than upside market beta.
- For the broad sample of U.S. stocks ranked separately into tenths by past one-month (short-term) and past five-year (long-term) returns:
- During 1984-2013, the short-term (long-term) loser-minus-winner portfolio generates a gross annualized return of 19% (6%).
- Opposite the findings for momentum, reversal winners (losers) have lower downside (upside) than upside (downside) market betas. Loser-minus-winner portfolios therefore have substantially higher downside than upside market betas.
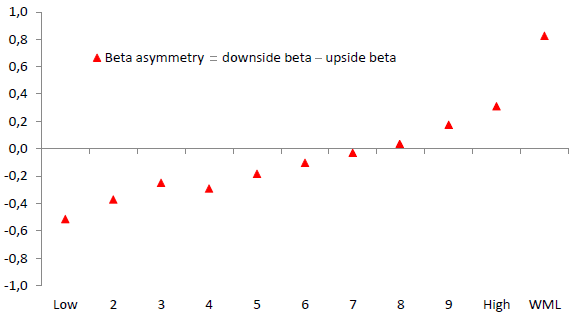
The following chart, adapted from the one in the paper, summarizes beta asymmetries (downside betas minus upside betas) across value-weighted portfolios of a broad sample of U.S. stocks ranked by momentum (total return from 12 months ago to one month ago) during January 1927 through July 2013. Results indicate that:
- Winners (High) have higher downside beta than upside beta.
- Losers (Low) have higher upside beta than downside beta.
- The WML portfolio therefore has much higher downside beta than upside beta.
- The trend in beta asymmetry is fairly systematic across momentum ranks.
WML portfolio performance arguably represents reward for bearing elevated downside risk.
In summary, evidence indicates that performances of intermediate-term momentum, short-term reversal and long-term reversal portfolios may be compensation for higher exposure to downside than upside equity market returns.
Results suggest two ways to enhance momentum strategy performance: (1) screen for assets that individually have higher downside than upside betas; and, (2) employ ancillary rules to detect and avoid strong market advances (when the large negative beta asymmetry of losers hurts WML portfolios).
Cautions regarding findings include:
- Portfolio returns reported in the study are gross, not net. Including the trading frictions associated with monthly portfolio turnovers and shorting costs would reduce these returns. Monthly turnovers may vary across momentum ranks in ways that affect findings.
- The paper ignores shorting constraints. It is probably not possible to implement fully the short sides of WML portfolios.