Do corporate bond returns, like stock returns, exhibit intermediate-term momentum? In their July 2010 paper entitled “Momentum in Corporate Bond Returns”, Gergana Jostova, Stanislava Nikolova, Alexander Philipov and Christof Stahel measure return momentum for U.S. corporate bonds. They form equally-weighted momentum portfolios monthly based on past six-month return, with a skip-month between ranking interval and portfolio formation to avoid short-term reversal, holding each portfolio for six months. Using total returns associated with 3.2 million quotes and transactions for 77,150 bonds over the period 1973-2008, they find that:
- The mean (median) monthly total return for bonds in the sample is 0.66% (0.62%).
- About 82%of rated bonds are investment grade (BBB- or above), and 18% are non-investment grade.
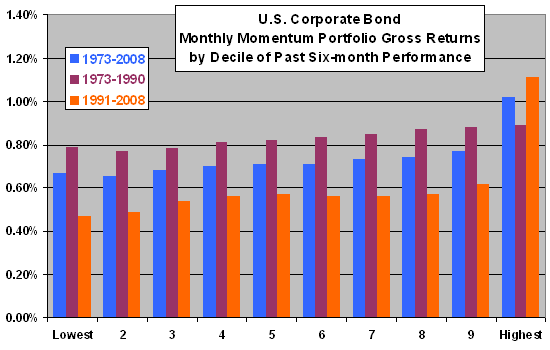
- Bond momentum profitability derives from the second half of the sample period (1991-2008), during which portfolios that are long (short) the bonds with the highest (lowest) past six-month return generate an average gross monthly return of 0.64%. (See the chart below.)
- This momentum strategy is profitable only among non-investment grade bonds. Applied only to these low-grade bonds, the strategy yields an average gross monthly return of 1.9%, easily surviving conservative trading friction estimates to generate an average six-month netreturn of about 10%. In fact:
- Profitability of the momentum strategy disappears after removing the worst-rated 8% of observations.
- During 1991-2008 period, the momentum strategy generates a gross monthly return of 1.73% among the fifth of stocks with the highest credit risk, but less than 0.21% for each of the other four quintiles of credit risk.
- The low proportion of non-investment grade bonds during 1973-1990 may explain the lack of momentum among all bonds for that subperiod. In fact, the worst-rated bonds do exhibit momentum during 1973-1990.
- Unlike equities, bond momentum profitability derives principally from past winners (see the chart below).
- While momentum is strongest among bonds with the lowest credit ratings, commonly used risk factors do not explain the anomaly. Nor do liquidity, periods around rating changes, choice of bond price database or survivorship bias substantially explain the anomaly.
The following chart, constructed from data in the paper, shows average gross monthly returns of U.S. corporate bonds by decile of past six-month returns (constructed and measured as described above) over the entire sample period and two equal subperiods. Results indicate that: (1) momentum is largely absent in the earlier subperiod (perhaps due to the relative paucity of low-grade bonds during that time); and, (2) extreme winners drive overall results.

In summary, evidence indicates that investors may be able to exploit momentum in U.S. corporate bond returns by focusing on past winners among low-grade issues.