Is momentum on a losing streak? Or, has proliferation of momentum strategies extinguished the anomaly? In the October 2010 revision of his paper entitled “Are Momentum Strategies Still Profitable for U.S. Equity?”, Scott Wilson examines the recent performance of a momentum hedge strategy that each month buys (sells) the tenth of stocks with the highest (lowest) lagged six-month returns. He employs (overlapping) six-month holding intervals and focuses on equal weighting of stocks at formation. Using monthly data for stocks traded on the NYSE, AMEX and NASDAQ, excluding the tenth with the smallest market capitalizations and those priced below $5, during 1965 through 2009, he finds that:
- Over the entire sample period, the selected hedge strategy generates an average gross monthly return of 1.14% over the six-month holding interval. Value weighting reduces this return to 0.98%.
- Segmenting the sample based on market capitalization confirms, as implied by the difference between equal and value weighting, that small stocks drive the momentum effect. Over the entire sample period, average gross monthly hedge strategy return progressively decreases across size quintiles from 1.32% for the smallest fifth stocks to 0.71% for the largest fifth of stocks.
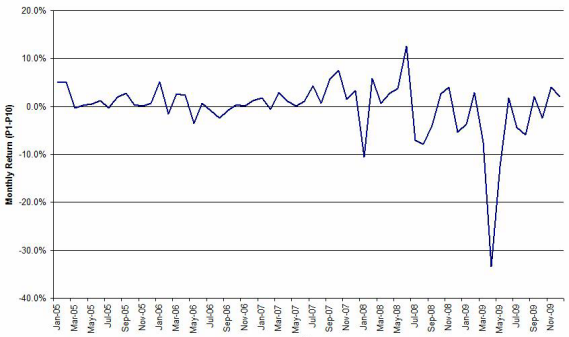
- The selected hedge strategy is less profitable since 1998 and is actually unprofitable during 2005 through 2009 (see the chart below).
The following chart, taken from the paper, shows gross monthly returns for the selected momentum hedge strategy during 2005 through 2009. The strategy each month buys the tenth of stocks with the highest lagged six-month return (P1) and sells the tenth with lowest (P10), holding each such portfolio for six months, such that there are six active portfolios during each month. The return for each month is the average return for the six active portfolios. The overall average (median) gross monthly return for the strategy during this subperiod is -0.16% (0.70%).

In summary, evidence from straightforward testing indicates that profitability of momentum investing in U.S. stocks has declined over time and disappeared in recent years.
Cautions regarding findings include:
- Reported returns are gross, not net. Including reasonable trading frictions and shorting costs would reduce returns.
- A five-year subsample is quite small for inference regarding a strategy that involves six-month ranking and six-month holding intervals.
- Different ranking and holding intervals may enhance momentum strategy profitability compared to reported results (but optimization introduces data snooping bias). A market adaptation argument perhaps argues for shortening ranking and holding intervals.
- Adjacent ranking and holding intervals assume that an investor could slightly anticipate rankings to form portfolios at the same close.