Does the rate of change of return momentum (return acceleration) usefully predict stock returns? In their August 2015 paper entitled “The Acceleration Effect and Gamma Factor in Asset Pricing”, Diego Ardila-Alvarez, Zalan Forro and Didier Sornette compare the effectiveness of return acceleration (difference between returns for the last six months and the preceding six months) and return momentum as stock return predictors. They devise and test an acceleration factor (which they call gamma) by each month ranking stocks into tenths (deciles) by acceleration and measuring the returns to a monthly reformed hedge portfolio that is long (short) the value-weighted decile with the highest (lowest) acceleration. They also test trading strategies that each month weight stocks according to the ratio of prior-month stock acceleration to the average prior-month acceleration of all stocks versus similarly constructed momentum strategies for 36 combinations of different: ranking intervals (3, 6 or 12 months); holding intervals (1, 3, 6 or 12 months); and, implementation delays (1, 3 or 6 months). Using monthly data for a broad sample of U.S. common stocks and monthly market, size, book-to-market and momentum risk factors during May 1963 through December 2013, they find that:
- The acceleration factor outperforms the widely used market, size, book-to-market and momentum factors over the sample period:
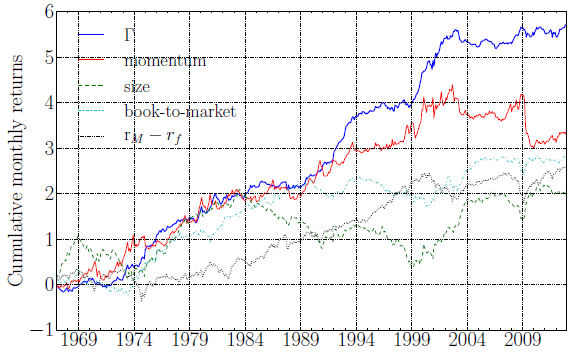
- Annualized gross average excess (relative to the risk-free rate) return for the acceleration factor is 12%, compared to 6%, 5%, 6% and 7% for the market, size, book-to-market and momentum factors, respectively (see the chart below).
- Annualized volatilities are 15% for the acceleration factor and 15%, 18%, 15% and 25% for the other factors, respectively.
- Annualized gross Sharpe ratio is 0.46 for acceleration factor and 0.08, -0.01, 0.05 and 0.09 for the other factors, respectively.
- The acceleration factor outperforms the momentum factor based on gross average excess return and gross Sharpe ratio for 12 of 13 equity sectors.
- Regressions show that the widely used three-factor (market, size, book-to-market) and four-factor (plus momentum) models of stock returns do not explain acceleration factor returns.
- A double sort shows that the acceleration factor explains the momentum factor, but not vice versa, suggesting that momentum is an imperfect proxy for acceleration.
- Based on both average gross excess return and gross Sharpe ratio, acceleration trading strategy variations as specified above beat corresponding momentum strategies for two-thirds of variations. The best acceleration strategies employ 6-month ranking and holding intervals.
The following chart, taken from the paper, compares cumulative gross excess returns for the acceleration (gamma)????, momentum, size, book-to-market and market factors. The first four are constructed from portfolios that are long (short) the tenth of stocks with the highest (lowest) expected returns. The chart shows that the acceleration factor has the strongest overall performance.

In summary, evidence indicates that return acceleration may be a superior substitute for return momentum in stock return modeling and stock portfolio strategies.
Cautions regarding findings include:
- All findings are gross, not net. Accounting for trading frictions and shorting costs (where indicated) would reduce factor/strategy performance. Shorting of stocks with the lowest expected returns may not always be feasible.
- Moreover, acceleration factor portfolios and strategies may have high turnovers than those for other factors, such that net findings may differ from gross findings.
- There is snooping bias in the identification of the optimal acceleration trading strategy parameter values, such that results for these values overstate expectations. Also, it appears that the authors employ the optimal ranking interval in testing the acceleration factor.
- As noted in the paper regarding the chart above, the acceleration factor does not beat (on a gross basis) the momentum factor or the market during the first half of the sample period, indicating that there may be long periods when it underperforms the market on a net basis.
For related research see: “Buying on Impulse (Change in Momentum)”, “Stock Price Acceleration as a Momentum Investing Enhancement” and “Extreme Appreciation as a Stock Crash Indicator”.