A subscriber asked for augmentation of “SACEMS at Weekly and Biweekly Frequencies” to determine whether bimonthly (every two months) measurement of asset class momentum works better than monthly measurement as used in “Simple Asset Class ETF Momentum Strategy” (SACEMS). To investigate, we apply a bimonthly strategy to the following eight asset class exchange-traded funds (ETF), plus cash:
PowerShares DB Commodity Index Tracking (DBC)
iShares MSCI Emerging Markets Index (EEM)
iShares MSCI EAFE Index (EFA)
SPDR Gold Shares (GLD)
iShares Russell 2000 Index (IWM)
SPDR S&P 500 (SPY)
iShares Barclays 20+ Year Treasury Bond (TLT)
Vanguard REIT ETF (VNQ)
3-month Treasury bills (Cash)
We use the same lookback interval as for basic SACEMS and consider portfolios of past ETF winners based on Top 1 and on equally weighted (EW) Top 2 and Top 3. Since a bimonthly lookback interval uses every other set of monthly signals, we consider two variations: (1) start at the end of July 2006, when signals are first available for the entire set of ETFs, and end with May 2017; and, (2) start at the end of August 2006 and end with June 2017. We consider as benchmarks an equally weighted portfolio of all ETFs, rebalanced monthly (EW All) and basic monthly SACEMS. We focus on gross compound annual growth rates (CAGR), annual returns and maximum drawdowns (MaxDD) as performance metrics. Using monthly dividend-adjusted closing prices for the asset class proxies and the yield for Cash during February 2006 (when all ETFs are first available) through June 2017 (137 months), we find that:
For both bimonthly variations, we use a 5-month lookback interval as in basic SACEMS.
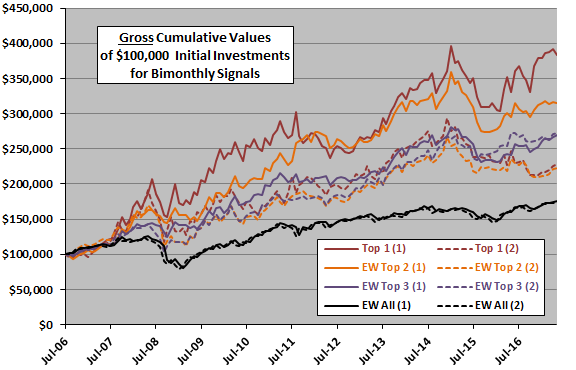
The following chart compares gross cumulative performances of Top 1, EW Top 2 and EW Top 3 portfolios for variations (1) and (2) of bimonthly SACEMS over the available sample period. Those appended with “(1)” are for the end of July 2006 start, and those appended with “(2)” are for the end of August 2006 start. The time scale is one month off for variation (2) to accommodate comparison over the same duration. Notable points are:
- All momentum portfolios outperform naive, equally weighted diversification across all assets.
- Top 1 (1) and EW Top 2 (1) perform best, but are volatile. The big differences between Top 1 (1) and Top 1 (2), and between EW Top 2 (1) and EW Top 2 (2), suggest a lot of noise (luck) in play. Results for EW Top 3 (1) and EW Top 3 (2) suggest that, as we suppress noise via diversification, the bimonthly variations perform similarly.
- The momentum portfolios have not recently performed well.
How do the above performances compare to those of basic monthly SACEMS and to weekly and biweekly SACEMS?
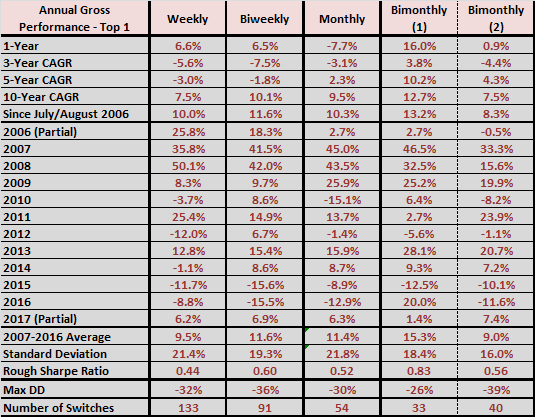
The following table compares (mostly) annual performance statistics for weekly, biweekly, monthly and the two bimonthly SACEMS Top 1 portfolios with comparable lookback intervals over the available sample period. Results for weekly, biweekly and monthly SACEMS are through May 2017, matching bimonthly (1). Rough Sharpe ratio ignores the risk-free rate, which is near zero for most of the sample period. Notable points are:
- Based on returns, bimonthly (1) is the clear winner and bimonthly (2) is the clear loser. Bimonthly (1) has the shallowest MaxDD and bimonthly (2) the deepest. A reasonable interpretation is that luck plays a big role for Top 1 portfolios and especially for less frequent sampling of data.
- Higher measurement frequencies mean more ETF switches and therefore higher trading frictions, such that net results may differ from gross results. The difference in number of switches between bimonthly (1) and bimonthly (2) again points to noisiness.
- Differences in performance across measurement frequencies indicate that the momentum model overall is subject to considerable noise.
It is reasonable to view bimonthly SACEMS performance as the average performance of bimonthly (1) and bimonthly (2).
What about the EW Top 2 portfolios?
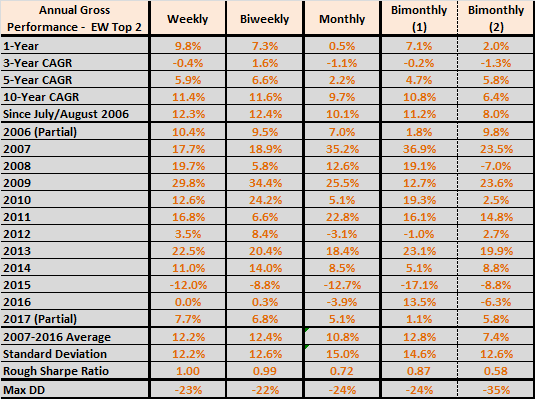
The next table compares (mostly) annual performance statistics for weekly, biweekly, monthly and the two bimonthly SACEMS EW Top 2 portfolios with comparable lookback intervals over the available sample period. Notable points are:
- Based on returns, weekly and biweekly measurement frequencies are best, with similar MaxDDs for all portfolios except bimonthly (2). Again, bimonthly (1) far outperforms bimonthly (2), and bimonthly (2) has the deepest MaxDD.
- Again, higher measurement frequencies mean more ETF switches and therefore higher trading frictions, such that net results may differ from gross results.
- Again, differences in performance indicate considerable noise effects on the momentum model overall.
What about the EW Top 3 portfolios?
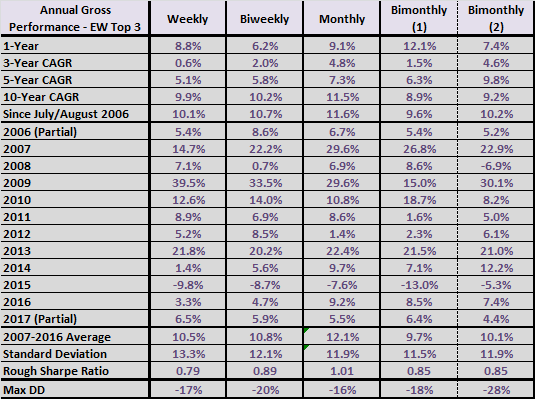
The final table compares (mostly) annual performance statistics for weekly, biweekly, monthly and the two bimonthly SACEMS EW Top 3 portfolios with comparable lookback intervals over the available sample period. Notable points these most diversified portfolios are:
- Based on returns and rough Sharpe ratio, the monthly measurement frequency is best, with similar MaxDDs for all portfolios except bimonthly (2). With increased diversification, bimonthly (1) and bimonthly (2) exhibit similar performance, perhaps not capturing momentum as effectively as basic monthly SACEMS.
- Again, higher measurement frequencies mean more ETF switches and therefore higher trading frictions, such that net results may differ from gross results.
- Again, differences in performance indicate considerable noise effects on the momentum model overall.
In summary, evidence from a limited sample period suggests that SACEMS at a bimonthly frequency is a little wilder than basic monthly SACEMS and perhaps a little weaker for a diversified momentum portfolio, but switches less frequently.
Cautions regarding findings include:
- Sample size is modest (about 27 independent lookback intervals).
- As noted, measurements are misaligned by one month for bimonthly (1) and bimonthly (2) performance data.
- Measurement frequency affects MaxDD measurements, tending to deepen for higher frequency.
- As noted, analyses are gross. Accounting for costs of regular portfolio reformation would reduce returns, and performance reduction deepens as portfolio reformation frequency increases.
- Bimonthly performance statistics implicitly assume monthly rebalancing to equal weight for EW Top 2 and EW Top 3 even for alternate months when ignoring momentum signals (to simplify adaptation of basic SACEMS programming). Deciding not to rebalance would probably not have a large effect.
- Other bimonthly lookback intervals may work better, but experimentation would elevate data snooping bias, which is especially pernicious for small samples.
- Other cautions noted in in “Simple Asset Class ETF Momentum Strategy” apply.