Subscribers have requested extension of the momentum ranking interval robustness test in “Simple Asset Class ETF Momentum Strategy Robustness/Sensitivity Tests” to portfolios other than the momentum winner (Top 1), which each month ranks the following eight asset class exchange-traded funds (ETF), plus cash, on past return and rotates to the strongest class:
PowerShares DB Commodity Index Tracking (DBC)
iShares MSCI Emerging Markets Index (EEM)
iShares MSCI EAFE Index (EFA)
SPDR Gold Shares (GLD)
iShares Russell 1000 Index (IWB)
iShares Russell 2000 Index (IWM)
SPDR Dow Jones REIT (RWR)
iShares Barclays 20+ Year Treasury Bond (TLT)
3-month Treasury bills (Cash)
We consider the following additional five portfolios: equally weighted top two (EW Top 2); equally weighted top three (EW Top 3); loser (Bottom 1); equally weighted bottom two (EW Bottom 2); and, equally weighted bottom three (EW Bottom 3). We consider momentum ranking intervals ranging from one month (1-1) to 12 months (12-1), all with one-month holding intervals (monthly portfolio reformation). The sample starts with the first month for which all ETFs are available (February 2006) and portfolio formation starts with the first month allowed by the longest momentum ranking interval (March 2007). We focus on gross compound annual growth rate (CAGR) and gross maximum drawdown (MaxDD) as key portfolio performance statistics, ignoring monthly reformation costs. Using monthly total returns for the specified assets during February 2006 through February 2016, we find that:
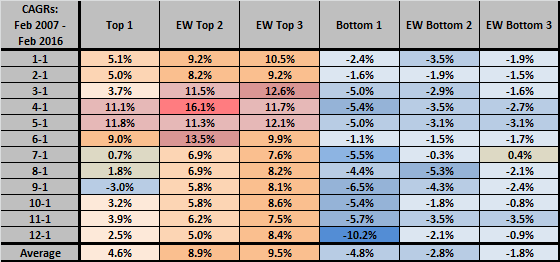
The following table compares gross CAGRs for the various portfolios across the 12 momentum ranking intervals for investments from the end of February 2007 through the end of February 2016 (nine years). Color coding helps distinguish hot from cold combinations. For comparison, the CAGR for dividend-reinvested SPDR S&P 500 (SPY) over the same period is 5.7%. Results suggest that:
- EW Top 3 is much safer (robust to model snooping/misspecification) than either Top 1 or EW Top 2.
- The optimal momentum ranking interval may be shorter for EW Top 3 than for Top 1 and EW Top 2.
- There is no evidence among bottom portfolios of opportunities for contrarian exploitation of reversion or reversal.

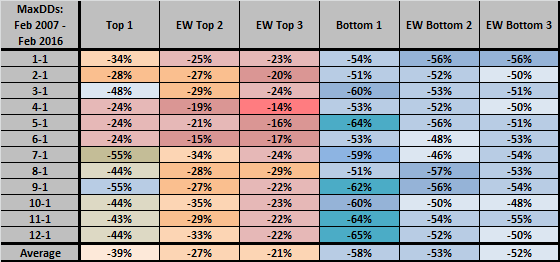
The following table compares gross MaxDDs for the various portfolios across the 12 momentum ranking intervals over the same sample period. Again, color coding helps distinguish hot from cold combinations. Results generally confirm those listed above regarding robustness of EW Top 3 and optimal momentum ranking interval.

In summary, evidence from momentum measurement interval robustness testing across SACEMS alternative portfolios suggest focusing on EW Top 3 based on returns over the previous four or five months.
Cautions regarding findings include:
- As noted, performance calculations are gross, not net. Accounting for monthly portfolio reformation costs would reduce returns.
- Testing multiple alternative portfolios and many momentum ranking intervals on the same sample introduces considerable data snooping bias, such that the best performances overstate expectations.
- The sample period is very short in terms of variety of market conditions and relative to longer momentum ranking intervals, amplifying snooping bias. A particular risk is that the short available sample period contains the unusual 2008-2009 financial crisis, so optimization tends to fit that event. Evidence from the body of research over longer sample periods offers some mitigation of this concern.
- Costs of portfolio reformation and shorting probably make exploitation of bottom portfolios impractical as a pure play.