Does combining past return rankings at long (multi-year) and short (3-12 months) intervals offer a means of boosting momentum strategy returns? In their August 2013 paper entitled “Price Momentum Components: Evidence from International Market Indices”, Graham Bornholt and Mirela Malin compare strategies based on the interplay of short-term continuation and long-term reversal as applied to country stock market indexes. They define short-term as 3, 6, 9 or 12 months (focusing on 6 months). They define long-term as 36, 48 or 60 months. They consider three kinds of momentum strategies:
- Traditional – each month, buy (sell) the fourth of country market indexes with the highest (lowest) short-term past returns.
- Early-stage – each month, first identify the fourth of country markets that are short-term winners and the fourth that are short-term losers. Then buy (sell) the half of these winners (losers) with the lowest (highest) long-term returns, thereby focusing on indexes with recent price reversals.
- Late-stage – each month, first identify the fourth of country markets that are short-term winners and the fourth that are short-term losers. Then buy (sell) the half of these winners (losers) with the highest (lowest) long-term returns, thereby focusing on indexes with consistent price continuation.
They weight selected indexes equally. They consider short-term holding intervals of 1, 3, 6, 9 or 12 months (with overlapping portfolios when longer than a month) and a long-term holding interval of five years. When calculating monthly returns, they insert a skip-month between the ranking and holding intervals and use a simple (equally weighted) average of returns for any active overlapping portfolios. When examining long-term performance, they do not insert a skip-month and use average returns for each month after portfolio formation. Using monthly total returns in U.S. dollars for 18 developed and 26 emerging country stock market indexes as available during January 1970 through April 2013 (220 to 520 observations per market), they find that:
- Based on gross monthly returns, traditional momentum generally works (does not work) for developed (emerging) markets:
- For developed markets, momentum profits are significant for all combinations except ranking-holding intervals 3 months-1 month and 12 months-12 months. For 6-month ranking and holding intervals, the average gross monthly return for winners (losers) is 1.46% (0.78%), for a hedge portfolio difference of 0.68%.
- For emerging markets, both winners and losers perform well. Only the 6 months-6 months ranking-holding interval combination generates a significant average gross hedge portfolio return (0.77%).
- Based on gross monthly returns, the early-stage (late-stage) strategy generally outperforms (underperforms) traditional momentum:
- For both developed and emerging markets, the early-stage strategy with 6-month holding interval works best. For example, a 6-month short-term ranking interval in combination with a 60-month long-term ranking interval, with a 6-month holding interval, generates an average gross monthly hedge portfolio return of 0.78% (0.87%) when applied to developed (emerging) markets.
- Most (all) late-stage strategy hedge portfolio results for developed (emerging) markets are insignificant. For emerging markets, eight of 15 combinations generate negative average gross monthly returns.
- Monthly gross two-factor (market and value) alphas are similar to gross returns for all three kinds of strategies.
- Over the long term (see the charts below):
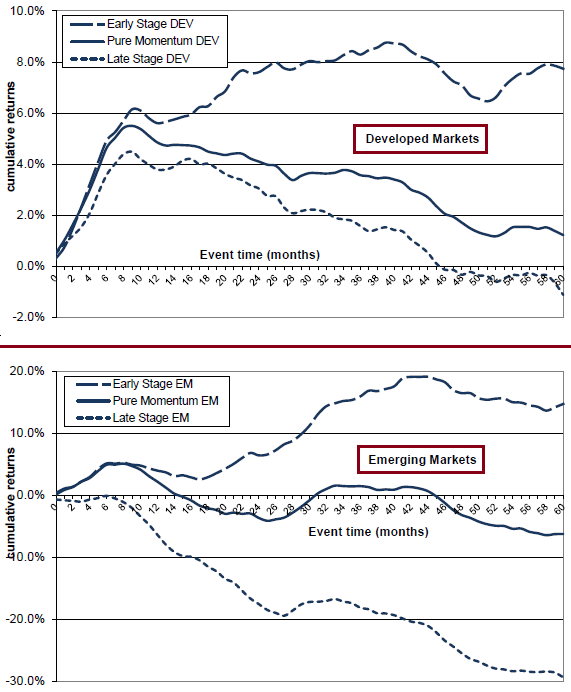
- For developed markets, traditional momentum produces significant gross hedge returns during the first year in the range 4.4%-5.7%, but returns for years two through five are uniformly negative. For emerging markets, first-year returns are generally positive but insignificant, and later-year returns are mixed.
- For both developed and emerging markets, early-stage strategy gross hedge returns are somewhat stronger than those of traditional momentum after one year, and these returns do not reverse in subsequent years.
- For developed markets, late-stage strategy gross hedge returns are weaker than those of traditional momentum after one year, and the subsequent reversal more pronounced. For emerging markets, returns are negative the first year and most subsequent years.
The following charts, adapted from the paper, show average gross cumulative hedge portfolio returns during the 60 months after formation for developed markets (upper chart – DEV) and emerging markets (lower chart – EM) for traditional momentum, the early-stage strategy and the late-stage strategy based on the following parameters: 6-month short-term ranking interval; 60-month long-term ranking interval; and, no skip-month between ranking and portfolio formation.
For developed markets, the traditional (Pure) momentum return climbs steadily to 5.5% at the end of month 10 and then reverses to 1.2% by the end of month 60. The early-stage strategy climbs steadily to 6.2% at the end of month 10, dips slightly to 5.6% and then resumes climbing to 8.8% by month 40. The late-state strategy trajectory is similar to, but lower than, that for traditional momentum. For emerging markets, the early-stage strategy peaks at 19.1% by month 44, while the late-stage strategy declines dramatically to -29.3% by month 60.

In summary, evidence indicates that, when applied to country stock markets, weak (strong) past long-term returns boost (diminish) the near-term performance and eliminate (amplify) the subsequent reversal of a traditional momentum strategy.
Cautions regarding findings include:
- The study uses indexes rather than tradable assets to measure returns. Including management/administration costs associated with implementation of funds to track the indexes may materially reduce reported returns, by percentages that vary by market.
- The study ignores trading frictions from periodic portfolio reformation and the costs of shorting indexes (if feasible). These costs vary considerably over time (see, for example, “Trading Frictions Over the Long Run”) and across countries, such that findings based on net returns may differ from those based on gross returns.
- Consideration of many combinations of ranking and holding intervals and multiple strategies introduces data snooping bias, such that the best-performing variations likely overstate out-of-sample performance.
- Differences in results for developed and emerging markets undermine belief in momentum pervasiveness.