Is relative momentum an effective way to switch between stocks and bonds? In his May 2014 paper entitled “Simple and Effective Market Timing with Tactical Asset Allocation”, Lewis Glenn compares the performances of two tactical asset allocation strategies:
- SPY-TLT: simple relative momentum strategy that each month holds SPDR S&P 500 (SPY) or iShares Barclays 20+ Year Treasury Bond (TLT) depending on which has the higher total return over the last three months.
- Ivy 5: diversified trend following strategy that initially allocates equal amounts to each of five funds: exchange-traded funds (ETF) representing U.S. stocks, non-U.S. large stocks, 7-10 year U.S. Treasuries and real estate, and a mutual fund representing commodities.Thereafter, each allocation remains in the fund (goes to cash) when the fund is above (below) its 10-month simple moving average (SMA10) the prior month.
He includes “nominal” transaction fees for trades but does not account for bid-ask spread or impact of trading frictions. Using monthly dividend-adjusted closes of the specified funds during 2004 (plus prior data for momentum/trend calculations) through 2013, he finds that:
- Over the specified sample period (see the first chart below):
- The average annual return of SPY-TLT exceeds 30%, three times that of Ivy 5.
- SPY-TLT generates 45 trades, compared to 70 for Ivy 5.
- The maximum drawdown for SPY-TLT is 18.8%, compared to 14.6% for Ivy 5.
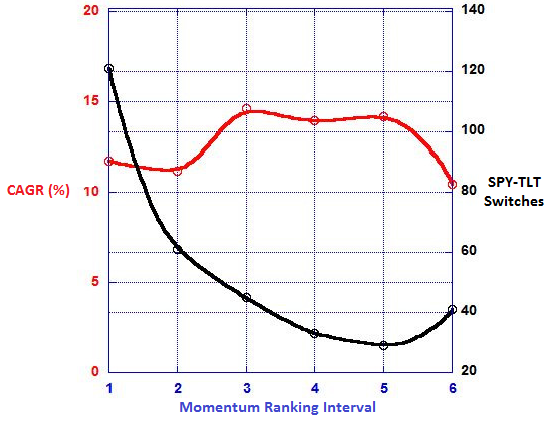
- SPY-TLT performance is fairly robust across momentum ranking intervals of three to five months, with compound annual growth rate (CAGR) optimal at three months (see the second chart below).
- A 25-year, less practical test using mutual funds rather than ETFs shows that the stocks-bonds switching strategy outperforms buying and holding either a U.S. stock fund or a U.S. Treasuries fund. However, there are extended subperiods during which switching underperforms stocks.
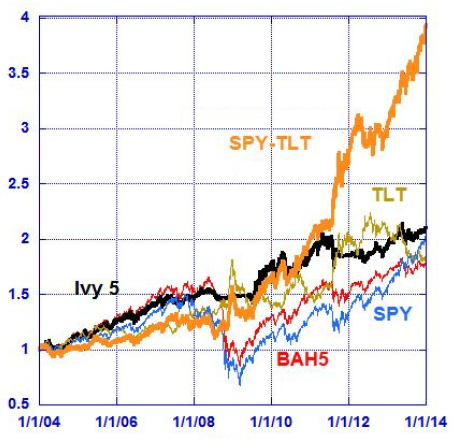
The following chart, taken from the paper, compares cumulative values of $1 initial investments at the beginning of 2004 in each of SPY-TLT, Ivy 5, buying and holding initially equal amounts of the Ivy 5 assets (BAH5), buying and holding SPY and buying and holding TLT.
The terminal value of SPY-TLT is considerably higher than all other allocations. However, SPY-TLT underperforms Ivy 5 for the first half of the sample period, with subsequent outperformance concentrating in the last two to three years of the sample period.
Maximum drawdowns for BAH5, SPY and TLT are 48.4%, 55.2% and 26.2%, respectively, higher than those cited above for SPY-TLT and Ivy 5.
The next chart, adapted from one in the paper, shows the sensitivity of SPY-TLT CAGR and number of SPY-TLT switches to the momentum ranking interval over the 10-year sample period. For the specified treatment of switching frictions, CAGR is optimal for ranking intervals in the range three to five months. Depending on assumptions about switching frictions, five months may outperform three months.
SPY-TLT maximum drawdown is a constant -18.8% for ranking intervals two months through five months.
In summary, evidence suggests that relative momentum over the past three to five months may be an effective signal for switching between stocks and bonds.
Cautions regarding findings include:
- As noted, calculations include a “nominal” switching friction (per the author $8 per $100,000 of value traded). For investors with modest accounts, conservative accounting for frictions would reduce reported performances of all active strategies and may affect some findings.
- A 10-year sample period is very short for evaluation of an SMA10-based strategy (only 12 independent 10-month intervals).
- As noted, the three-month momentum ranking interval is optimal and carries some data snooping bias. Outperformance of SPY-TLT concentrates in a few short intervals, thereby amplifying this bias.
- There may be snooping bias in the selection of SPY and TLT as the test pair.
- Execution of switches apparently takes place at the same close as momentum/SMA10 signals, requiring slight anticipation of these signals.
- The Ivy 5 and BAH5 competitors do not include periodic rebalancing of their five positions. Such rebalancing tends to capture of diversification benefits (but the author reports annual rebalancing of Ivy 5 has little effect in this case).
As a very simple confirmation of findings, we limited the choices of assets in the “Simple Asset Class ETF Momentum Strategy” to iShares Russell 1000 Index (IWB) and iShares Barclays 20+ Year Treasury Bond (TLT) with five-month momentum ranking interval and switching friction 0.25%. In this limited-choice version, the strategy picks either IWB or TLT as the momentum winner. A $1 investment in this limited-choice version at the end of December 2002 grows to a net $4.92 at the end of May 2014. Substituting SPY for IWB produces a net terminal value of $4.93. Retaining all nine assets in the strategy generates a, compared to a net $5.88 for the full-choice (one winner) version. Maximum drawdown for the limited choice version is -17%, compared to -25% for the full-choice version. Qualitatively, having more variety in the portfolio may offer resilience to more kinds of future economic/financial conditions.