What does price momentum of stocks, whether total or risk-adjusted, imply about future returns of associated corporate bonds? In their August 2012 paper entitled “Residual Equity Momentum for Corporate Bonds”, Daniel Haesen, Patrick Houweling and Jeroen Van Zundert compare the predictive powers of total stock price momentum and risk-adjusted (residual) stock price momentum to predict returns of same-firm bonds. To focus on firm effects, they remove the influence of interest rates by measuring bond returns in excess of duration-matched U.S. Treasury instruments. They form (overlapping) bond portfolios monthly by: (1) ranking firms into fifths (quintiles) based on cumulative stock returns in excess of the risk-free rate over a past interval (base case, six months); (2) skipping a month; and, (3) forming a hedge portfolio that is long (short) for the next 1, 3, 6 or 12 months the equally weighted bonds of firms in the quintile with the highest (lowest) past stock returns. They calculate residual stock returns via 36-month lagged rolling regressions of excess stock returns versus the Fama-French model risk factors (market, size, book-to-market). Using monthly returns for U.S. investment grade and high-yield corporate bonds and associated stocks (2,442 firms), and for duration-matched U.S. Treasury instruments and the three equity risk factors, during January 1994 through September 2011, they find that:
- Compared to a total momentum ranking, a residual momentum ranking improves average gross excess returns, halves volatilities and thus approximately doubles gross Sharpe ratios of hedged bond portfolios as defined above. For example, for a bond portfolio based on a 6-month stock momentum ranking interval and a 6-month holding interval, using residual rather than total momentum:
- Reduces annualized bond portfolio volatility from 6.16% to 3.25%.
- Improves annualized gross excess return from 2.16% to 2.69%.
- Increases annual gross Sharpe ratio from 0.35 to 0.83.
- Results are generally robust to variations in the ranking and holding intervals, the residual momentum calculation window, the specification of the equity factor model and corrections for bond liquidity and credit rating. Improvement from use of residual momentum is strongest for a 12-month ranking interval.
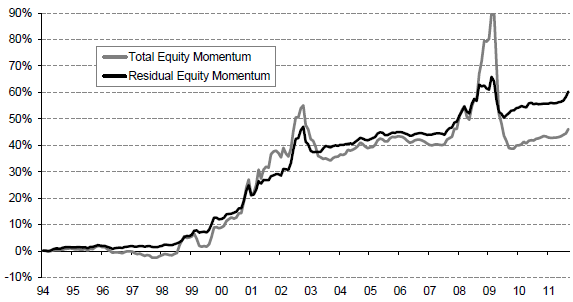
The following chart, taken from the paper, compares cumulative gross returns in excess of duration-matched U.S. Treasury instruments for portfolios that are long (short) the equally weighted bonds of the fifth of firms with the highest (lowest) total and residual stock returns over the past six months. The holding interval is six months, so portfolios overlap. There is a skip month between ranking and holding intervals. Residual stock momentum generally outperforms total momentum as a ranking criterion, suppressing volatility while maintaining or improving average return.
This hedged investment strategy is illustrative rather than realistic, since shorting corporate bonds may be cumbersome and costly.

In summary, evidence suggests that bond investors may be able to enhance risk-adjusted return and reduce drawdowns by focusing on bonds of firms with strong risk-adjusted stock price momentum.
Cautions regarding findings include:
- Residual momentum calculations may be burdensome for many investors (or costly if delegated to a manager).
- Reported returns are gross, not net. Including trading frictions for periodic bond portfolio reformation would reduce these returns. Any differences in bond portfolio turnover between the total and residual momentum criteria, and among different lengths of ranking and holding intervals, could affect findings.
- As noted, shorting bonds is problematic, so the hedge portfolio returns are illustrative rather than practical. In correspondence on 9/10/12, one of the authors reports: “For the Q1 [highest equity momentum bond] portfolio, we find for total equity momentum a mean [annualized] return, volatility and Sharpe of 1.20%, 1.69% and 0.71, respectively. For residual equity momentum, [these metrics are] 1.28%, 1.14% and 1.12. These returns are in excess of duration-matched Treasury returns…”
- A one-month lag between ranking and holding intervals is cautious. It would be interesting to consider a more agile response time.
- Considering different combinations of ranking and holding intervals introduces data snooping bias, such that the best combination likely overstates out-of-sample expectation.