Is recent weakness in the stock return momentum anomaly, perhaps representing market adaptation to widespread anomaly exploitation, permanent or transitory? In their July 2016 paper entitled “Where Has the Trend Gone? An Update on Momentum Returns in the U.S. Stock Market”, Steven Dolvin and Bryan Foltice explore recent profitability of stock return momentum trading in the U.S. market. They each month rank stocks into tenths (deciles) based on cumulative return over the past six months and measure returns of equally weighted decile portfolios over the next 12 months (designating the strategy “6/12”), resulting in overlapping portfolios. To assess trends in momentum strategy performance, they examine average performance of decile portfolios during three subperiods: 1986-2006, 2007-2015 and 2010-2015. For robustness, they repeat some tests for 6/6, 3/6, and 3/12 ranking/holding intervals. Using monthly returns for a broad sample of U.S. stocks during July 1985 through December 2015, they find that:
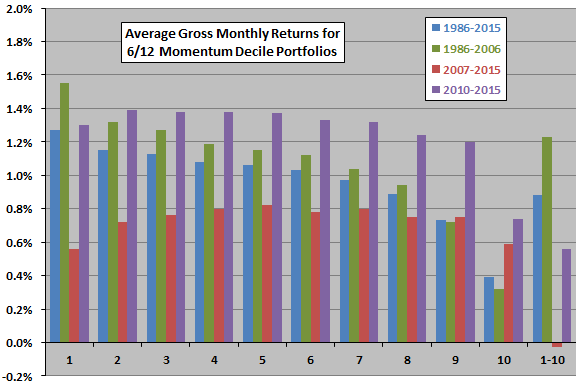
- For the 6/12 strategy over the entire 1986-2015 sample period, average gross monthly holding interval return decreases systematically from the extreme winner decile (1.27%) to the extreme loser decile (0.39%), such that a long-short hedge portfolio offers average gross monthly return 0.88% and average gross monthly three-factor (market, size, book-to-market) alpha 0.97%.
- For the 6/12 strategy over the 1986-2006 subperiod, average gross monthly holding interval return more strongly decreases systematically from the extreme winners (1.55%) to the extreme losers (0.32%), such that a long-short hedge portfolio offers average gross monthly return 1.23% and average gross monthly three-factor alpha 1.21%.
- However, for the 6/12 strategy over the 2007-2015 subperiod, average gross monthly holding interval returns do not vary systematically across deciles. In fact, the extreme winners have the lowest average return (0.56%) and a negative three-factor alpha, such that a long-short hedge portfolio offers average gross monthly return -0.03%.
- For the 6/12 strategy over the 2010-2015 subperiod, average gross monthly holding interval returns again do not vary systematically across deciles, with middle deciles performing best. But, extreme losers do have a relatively weak average return, such that a long-short hedge portfolio offers average gross monthly return 0.56% and average gross monthly three-factor alpha 0.59%. (See the chart below for visualization.)
- Results for the 6/12, 6/6, 3/6 and 3/12 strategy variations during 2007-2015 and 2010-2015 are similar.
The following chart, constructed from data in the paper, summarizes average gross monthly returns for equally weighted 6/12 momentum deciles, and for the winners-minus-losers hedge portfolio (1-10), over the entire sample period and several subperiods. Results indicate that:
- Over the entire sample period and the 1986-2006 subperiod, the conventional stock return momentum anomaly holds on a gross basis.
- During 2007-2015, momentum does not work. A long-only strategy (long winners) underperforms the market.
- During 2010-2015, momentum works on a gross basis, but less robustly than before the financial crisis and due largely to the poor performance of extreme losers (and therefore shorting). A long-only strategy is unimpressive.
In summary, evidence from the past 20 years does not support belief in the consistency of the momentum anomaly for U.S. stocks.
Cautions regarding findings include:
- Subsamples are very small in terms of independent momentum ranking and holding intervals and variety of market conditions. In the shortest subperiod, there are only six independent 12-month holding intervals.
- Reported returns are gross, not net. Including frictions for monthly portfolio formation would reduce these returns. Moreover:
- Stocks in extreme deciles may be least liquid (most costly to trade).
- Extreme decile hedge portfolios may incur material shorting costs, and shorting may not be feasible for some extreme loser stocks (no shares to borrow).
- The overlapping portfolio approach used in the study is not practical for many investors (too many positions, some of which are likely duplicates).