Is stock return momentum persistent over a very long sample? In their July 2013 paper entitled “212 Years of Price Momentum (The World’s Longest Backtest: 1801 – 2012)”, Christopher Geczy and Mikhail Samonov extend analysis of momentum in U.S. stock prices back to 1800. They measure a stock’s momentum as its return from 11 months ago to one month ago, with the skipped month avoiding any short-term reversal. They measure the momentum effect as the return for a portfolio that is each month long (short) the equally weighted third of stocks with the highest (lowest) momentum. They define excess return as the return above the market return. Because reliable shares outstanding data are unavailable, they define the market return as the equal-weighted (rather than value-weighted) average return for all stocks in the universe. They ignore dividends (also not reliably available). They define market state in terms of sign (up or down during the same interval used for stock momentum measurement) and duration (number of consecutive months up or down). Using monthly returns for a sample of publicly traded U.S. stocks during January 1800 through December 2012, with focus on the “new” data for 1800 through 1926, they find that:
- During 1800 through 1926, the average number of stocks in the sample is 272 per month, ranging from 10 for January 1800 to 781 for December 1926. The number generally grows over time, except for a sharp contraction in the early 1860s around the Civil War.
- During 1801-1926 (1927-2012), the average monthly gross excess return of momentum winners is 0.18% (0.34%), compared to -0.10% (-0.24%) for losers, with the overall sample period momentum effect therefore 0.28% (0.58%).
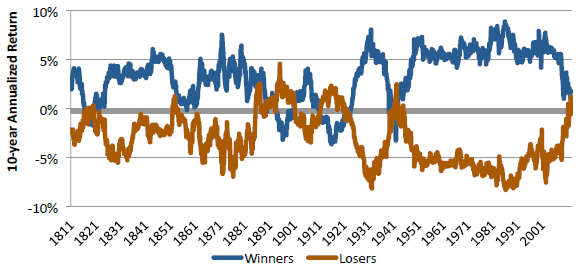
- Momentum effect gross profitability varies considerably over time (see the chart below). During 1801-1926, the 10-year annualized gross return is negative during the 1890s (-0.6%), 1900s (-2.1%) and 1920s (-1.2%) and varies from 0% to 15.3% over other decades. During the most recent decade of the overall sample period (January 2002 through December 2012), it is -2.1%.
- During 1801-1926 (1927-2012), momentum effect averages -0.1% (-3.3%) during January and 0.3% (0.9%) per month during non-January months.
- On average, during 1801-1926 (1927-2012), gross momentum effect profits build through the fourth (fifth) month after portfolio formation, but are statistically significant only for for the first two months. Profitability strongly reverses eight months after portfolio formation, with negative returns persisting for five years.
- Regarding market versus industry versus stock-specific (idiosyncratic) momentum effects:
- During 1801-1926, the common factor (market) momentum effect has a gross monthly average of 0.31%, compared to 0.25% for the combined 1801-2012 sample period.
- During 1801-1926, an equally weighted portfolio that is each month long (short) the three of ten industries with the highest (lowest) momentum generates an average gross monthly return of 0.40%, compared to 0.39% for the combined 1801-2012 sample period.
- During 1801-1926, the stock-specific momentum effect has a gross monthly average of 0.22%, compared to 0.70% for 1927-2012.
- In the first year of a new market state (up or down), momentum portfolio beta relative to the overall market is opposite the new market direction, thereby inhibiting momentum profitability around market turning points. In the second year and beyond, momentum beta takes on the sign of the market direction and adds to momentum returns. Specifically, during (after) the first year of all market states over the combined 1801-2012 sample period:
- The average monthly gross momentum effect is 0.4% (0.3%).
- The average monthly momentum portfolio beta contribution is -0.4% (0.1%).
- The average monthly momentum portfolio alpha contribution is 0.8% (0.2%).
- A strategy that hedges momentum portfolio market beta exposure during the first 10 (7) months of new up (down) markets but removes the hedge thereafter significantly boosts the momentum effect. Over the combined 1801-2012 period, such hedging increases average gross monthly returns from 0.6% to 0.9% per month in up market states and 0.1% to 0.2% in down market states. Across all market states, average gross monthly return improves from 0.4% to 0.7%.
The following chart, taken from the paper, shows 10-year rolling gross excess returns (relative to the equally weighted market) of a portfolio that is long (short) the equally weighted third of stocks with the highest (Winners) and lowest (Losers) momentum over the combined 1801-2012 sample period. Results show that the momentum effect varies considerably over time and can be unprofitable for extended intervals.
In summary, evidence indicates that the momentum effect for U.S. stocks during 1801-1926 is similar to (though often weaker than) that found since 1927.
Cautions regarding findings include:
- Reported returns are gross, not net. Including reasonable trading frictions associated with monthly portfolio reformation would materially reduce these returns. Trading frictions vary over time and may have been very high during during 1801-1926. Moreover, trading frictions may be especially high for momentum winners and losers. In other words, findings based on net returns may differ substantially from those based on gross returns.
- Also, shorting of losers may be unfeasible or very costly during much the sample period, rendering the winner minus loser portfolio analysis largely academic.
- The ignored effect of dividends on momentum measurement and subsequent profitability varies considerably over time and may materially alter findings.
- Analysis of the dynamically hedged momentum strategy is in-sample and therefore subject to data snooping bias in picking the timeframes for hedging and not hedging momentum portfolio beta exposure.