Is there a tractable way to combine momentum investing with Modern Portfolio Theory (MPT)? In their December 2013 paper entitled “Tactical MPT and Momentum: the Modern Asset Allocation (MAA)”, Wouter Keller and Hugo van Putten present a tactical, simplified, long-only version of MPT that applies momentum to estimate future asset returns. Specifically, they:
- Make MPT tactical by using short historical intervals to estimate future asset returns (rate of return, or absolute momentum), return volatilities (based on daily returns) and return correlations (based on daily returns), assuming that behaviors over a short historical interval will materially persist during the next month.
- Exclude from the portfolio any assets with negative estimated returns (i.e., negative returns over the specified historical interval).
- Simplify correlation calculations by relating daily historical returns for each asset to those for a single index (the equally weighted average returns for all assets) rather than to those for all other assets separately.
- Dampen any errors in rapidly changing asset return, volatility and correlation estimates by “shrinking” them toward their respective averages across all assets in the universe, and dampen the predicted market volatility by “shrinking” it toward zero.
They reform the MAA portfolio monthly at the first close. Their baseline historical interval for estimation of all variables is four months (84 trading days). Their baseline shrinkage factor for all variables is 50%. Their benchmark is the equally weighted (EW) “market” of all assets, rebalanced monthly. They assume a one-way trading friction of 0.1%. They consider a range of portfolio performance metrics: annualized return, annual volatility, maximum drawdown, Sharpe ratio, Omega ratio and Calmar ratio. Using daily dividend-adjusted prices for assets allocated to nine universes (of seven to 130 assets, generally consisting of asset class proxy funds) during November 1997 through mid-November 2013, they find that:
- For the simplest universe of seven mutual funds that track U.S. stock, international developed market stock, emerging market stock, two U.S. bond, U.S. real estate investment trust (REIT) and commodity indexes (see the chart below):
- The baseline MAA portfolio (EW benchmark) generates an annualized return of 9.3% (6.7%), with standard deviation of annual returns 6.2% (13.4%) and Sharpe ratio 1.1 (0.3).
- The boost in annualized return relative to the EW benchmark derives mostly from use of absolute momentum, shrunken or not, to estimate future asset returns (excluding assets with negative past returns).
- The suppression of volatility relative to the EW benchmark derives mostly from use of the (shrunken) MAA volatility factor.
- MAA performance is very sensitive (not very sensitive) to the amount of shrinkage applied to asset return and asset volatility (market volatility and asset correlation) estimates. 50% shrinkage is generally optimal over the entire sample period.
- MAA performance is sensitive to the length of the historical interval (from one to 12 months) used to estimate parameters, with four months optimal over the entire sample period. However, risk-adjusted performance beats the EW benchmark for all intervals.
- MAA performance with optimal parameters beats the EW benchmark for one-way trading friction up to roughly 1%.
- Applied to increasingly large universes of funds, MAA consistently beats the relevant EW benchmark across a range of performance metrics. However, likely because the asset class mixes differ across universes, MAA performance does not increase with universe size.
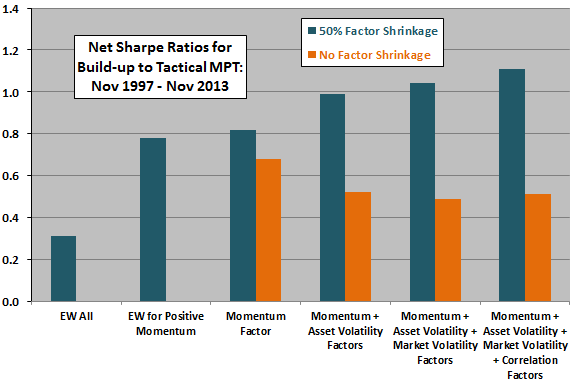
The following chart, constructed from data in the paper, summarizes the effect on net Sharpe ratio of building the MAA model factor-by-factor over the available sample period for the seven-asset universe, with and without 50% shrinkage of model parameters. All model parameter estimates are from asset return data over the past four months, with monthly portfolio reformation and 0.1% one-way trading friction. Specifically, the results are for the following six portfolios:
- EW All – all seven assets equally weighted.
- EW for Positive Momentum – the equally weighted combination of assets with positive past returns.
- Momentum Factor – assets with positive past returns weighted by shrunken past returns.
- Momentum + Asset Volatility Factors – incorporation of shrunken past volatilities.
- Momentum + Asset Volatility + Market Volatility Factors – further incorporation of shrunken past market volatility.
- Momentum + Asset Volatility + Market Volatility + Correlation Factors – further incorporation of shrunken past asset return correlations with the market.
Results suggest that estimating future asset returns with momentum and estimating future asset volatilities with shrunken past volatilities offer the largest pay-offs.
In summary, evidence from a 16-year sample indicates that a simplified, long-only momentum-linked MPT applied to funds with parameters (1) estimated from recent data and (2) then shrunken toward averages for the selected universe of funds consistently beats a simple equal-weight benchmark.
Cautions regarding findings include:
- Sensitivity tests indicate that the default settings for the historical interval (four months) and shrinkage factor (50%) are optimal, and this optimality materially drives MAA performance. To the extent that optimality derives from randomness rather than some fundamental aspect of financial markets, results for these settings overstate expected MAA performance. For example, as reported in the paper, optimal shrinkage weights for the first four years of the sample period differ substantially from those for the entire sample period, undermining belief that investors can determine optimal settings in advance.
- Much of the outperformance of MAA relative to the EW benchmark concentrates in the rare 2008 synchronized crashes across asset classes. Such an event may not recur.
- The assumed level of trading friction may be unrealistically low for some investors.
- Calculations involve considerable data collection/processing (or fees if delegated).
- The nine universes of assets overlap, such that asset return correlations across them are likely high, limiting their effectiveness as independent tests.