Is the momentum effect pervasive across different equity markets and persistent through different time periods? The overview of Chapter 3 in “Global Investment Returns Yearbook 2008: Synopsis”, which summarizes annual work performed by by Elroy Dimson, Paul Marsh and Mike Staunton for ABN AMRO, provides “findings from the longest momentum study ever undertaken.” Applying a 12-1-1 strategy (rank returns over the past 12 months, wait one month and then hold for one month until rebalancing) to very long-run UK data and more recent data for each of 17 country stock markets, they conclude that:
- For a 12-1-1 momentum strategy applied to UK stocks during 1956-2007 (excluding trading frictions):
- Stocks in the top fifth of past returns outperform those in the bottom fifth by a mean 10.8% (12.0%) per year on a value-weighted (equal-weighted) basis.
- Selecting winners/losers using a more restrictive top/bottom tenth increases the winner-minus-loser (WML) return gap.
- Limiting the universe of stocks to the Top 100 reduces the WML return gap to 7.0% year, but the relatively high liquidities of these stocks facilitate momentum strategy implementation.
- For a 12-1-1 momentum strategy applied to the Top 100 UK stocks during 1900-2007 (again, excluding trading frictions), those in the top fifth of past returns outperform those in the bottom fifth by a mean 10.3% per year on a value-weighted basis.
- These momentum returns are generally robust to the choice of ranking period, holding period, value versus equal weighting, definition of winners and choice of sample. However:
- There are periods when winners underperform losers, sometimes substantially.
- For the 12-1-1 strategy, monthly winner and loser turnovers average 31% and 33%, respectively, and the resulting trading costs may seriously impact performance.
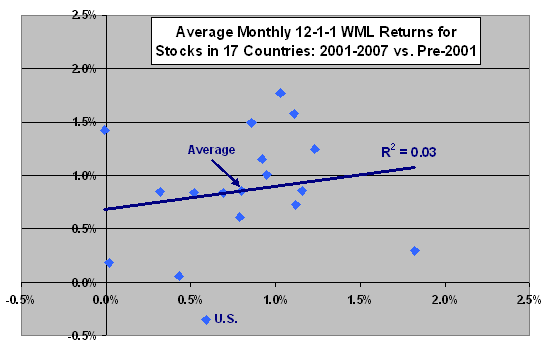
- The average monthly 12-1-1 WML return across 17 countries is 0.86% for 2001-07, compared to 0.80% up to the end of 2000 (from another study). The U.S. is the only market for which WML returns are negative during 2001-2007.
The following chart, constructed from data in the synopsis, relates average monthly 12-1-1 WML returns for stocks in 17 countries during 2001-2007 to the WML returns for the same countries up to the end of 2000. The Pearson correlation between the two series is 0.17, and the R-squared statistic is 0.03. These results offer little evidence that investors can use past momentum returns to anticipate future momentum returns on a country-by-country basis. Note that U.S. stocks have the lowest (and negative) momentum returns for 2001-2007.

In summary, in the words of the authors: “The momentum effect, both in the UK and globally, has been pervasive and persistent. Though costly to implement on a standalone basis, all investors need to be acutely aware of momentum. Even if they do not set out to exploit it, momentum is likely to be an important determinant of their investment performance.”