Does a time series (absolute or intrinsic) momentum strategy work at the stock level? In their January 2016 paper entitled “The Enduring Effect of Time-Series Momentum on Stock Returns Over Nearly 100-Years” Ian D’Souza, Voraphat Srichanachaitrchok, George Wang and Yaqiong Yao test the significance of time series momentum among individual stocks. Their baseline time series momentum strategy consists of each month calculating cumulative returns for each stock from 12 months ago to one month ago and taking a long (short) position for one month in stocks with positive (negative) past returns. For comparison, they also test a cross-sectional, or relative, momentum strategy that is each month long (short) the tenth, or decile, of stocks with the highest (lowest) cumulative returns over the same measurement interval. They skip the month between past return measurement and portfolio formation to avoid a reversal effect. They consider both value and equal weighting. They then test a dual momentum strategy that each month: (1) identifies time series momentum winners and losers; (2) ranks these two groups separately into fifths (quintiles); and, (3) buys the top quintile of time series winners and sells the bottom quintile of time series losers. Using monthly data for a broad U.S. stock sample during 1926 through 2014 and for stock samples from 13 other developed markets during mostly 1975 through 2014, they find that:
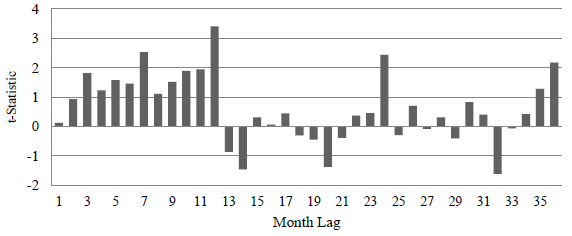
- Regressions indicate that time series momentum exists for past monthly returns up to 12 months ago (peaking at 12 months) and that insignificant time series reversion holds for many older monthly returns (see the first chart below).
- Time series momentum is significantly profitable on a gross basis among U.S. stocks over the 88 years from 1927 to 2014. Specifically:
- The baseline value-weighted (equal-weighted) time series momentum strategy generates an average gross monthly return of 0.55% (0.58%). By comparison, the corresponding value-weighted (equal-weighted) relative momentum strategy generates an average gross monthly return of 1.30% (0.69%).
- The time series momentum has a gross three-factor (market, size, book-to-market) alpha of 0.70%.
- The time series momentum strategy is strong among stocks in 10 of 13 developed markets.
- Time series momentum is generally robust across 16 combinations of past return calculation and holding intervals (with monthly rebalancing during the holding interval). The optimal combination for value (equal) weighting is a 12-month (9-month) past return calculation interval and 3-month (3-month) holding interval.
- Time series stock momentum is different from relative momentum, as follows:
- Unlike relative momentum, time series momentum performs well after both up and down markets. Specifically, time series momentum generates a gross average monthly return of 0.54% (0.57%) after up (down) markets. Relative momentum performs poorly after down markets.
- Unlike relative momentum, time series momentum does not suffer from losses in January.
- Drawdowns for time series momentum are much smaller than those for relative momentum.
- The dual momentum strategy:
- Generates an average gross monthly return of 1.88% (22.4% annualized, compared to 6.6% for time series momentum alone).
- Has, however, an annual volatility of 37.5%.
- Has an average market beta of -0.29.
- Generates a gross monthly four-factor (market, size, book-to-market, momentum) alpha of 1.02%.
- Is robust for different combinations of past return calculation and holding intervals (but is generally weaker for equal than value weighting).
- Most evidence points to a behavioral (underreaction) explanation for time series momentum.
The following chart, taken from the paper, summarizes t-statistics for relationships between past return by month from 1 to 36 months ago and next-month return for U.S. stocks pooled over the entire sample period. Results indicate:
- Momentum effects for past returns measured from 2 to 12 months ago (strongest at 12 months).
- Some small reversion effects for older returns.
- An echo momentum effect for returns 24 and 36 months ago.
For cumulative effect, results suggest return from 12 months ago to two months ago may be optimal for a time series momentum strategy. Unevenness in strength during this interval suggests some randomness.

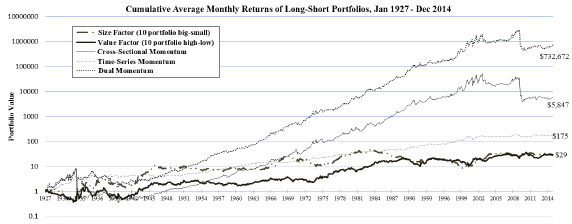
The next chart, also from the paper, compares cumulative gross values of $1 initial investments in five long-short U.S. stock strategies at the beginning of January 1927:
- Size Factor: smallest decile minus biggest decile of market capitalizations.
- Value Factor: top book-to-market decile minus bottom book-to-market decile.
- Cross-Sectional (Relative) Momentum: as specified above.
- Time Series Momentum: as specified above.
- Dual Momentum: as specified above.
The dual momentum strategy significantly outperforms other strategies and suffers less than relative momentum during the 1932 and 2009 crashes. However, relative momentum and (consequently) dual momentum have not performed well since about 2000.

In summary, evidence indicates that (1) time series momentum exists among individual stocks in developed markets and (2) time series momentum is sufficiently different from relative momentum that combining them outperforms both.
Cautions regarding findings include:
- Performance results are gross, not net. Accounting for portfolio reformation/rebalancing frictions (which are very high over parts of the sample period) and shorting costs would reduce returns. Moreover:
- Shorting may not have been feasible for some stocks at some times (no shares to borrow).
- Costs (portfolio turnover and liquidity) may vary across strategies, such that net relative performance may differ from gross relative performance.
- As noted, pronounced unevenness in the strength of time-series momentum for different past months suggests a noticeable randomness component, leading to material data snooping bias in selection of a past return measurement interval.
- More generally, testing of different strategies, parameter values and weighting schemes on the same set of data introduces snooping bias, such that best combinations overstate expectations.
- As noted, dual stock momentum as specified does not perform well over the past 15 years or so. Loss of effect could indicate strategy crowding/adaptation.
- Monthly screening of large numbers of stocks and implementation of large portfolios is beyond the reach of many investors, who would pay fees for delegating these processes to a fund.