The “Simple Asset Class ETF Momentum Strategy” each month allocates all funds to the one of the following eight asset class exchange-traded funds (ETF), or cash, with the highest total return over the past five months:
PowerShares DB Commodity Index Tracking (DBC)
iShares MSCI Emerging Markets Index (EEM)
iShares MSCI EAFE Index (EFA)
SPDR Gold Shares (GLD)
iShares Russell 1000 Index (IWB)
iShares Russell 2000 Index (IWM)
SPDR Dow Jones REIT (RWR)
iShares Barclays 20+ Year Treasury Bond (TLT)
3-month Treasury bills (Cash)
“Simple Asset Class ETF Momentum Strategy Robustness/Sensitivity Tests” shows that, among uniform ranking intervals, five months is optimal. Citing the optimality of a three-month ranking interval in “Simple Debt Class Mutual Fund Momentum Strategy”, a subscriber inquired whether using a three-month ranking interval just for TLT might improve Simple Asset Class ETF Momentum Strategy performance. To investigate more generally, we compute net terminal values for 108 variations of the strategy by letting the ranking interval for each asset range from one to 12 months, while holding the ranking interval for all other assets at five months. In order to compare ranking intervals of different lengths, we use the average total return per month for ranking. For example, the average monthly total return for a five-month ranking interval is the five-month total return divided by five. Using monthly dividend-adjusted closes for the asset class proxies and the yield for Cash during July 2002 (or inception if not available then) through May 2014 (141 months), we find that:
Note that number of ETFs in competition increases over time, as follows:
- EFA, IWB, IWM, RWR and TLT are available over the entire sample period.
- EEM is available starting April 2003.
- GLD is available starting November 2004.
- DBC is available starting February 2006.
Specific trading assumptions are:
- Start all calculation in July 2003 to accommodate the longest ranking interval of 12 months.
- Reallocate at the close on the last trading day of each month (assume that total past returns for the ETFs can be calculated just before the close).
- Trading (switching) friction is 0.25% of the balance whenever there is a change in holdings.
- Ignore any tax implications of trading.
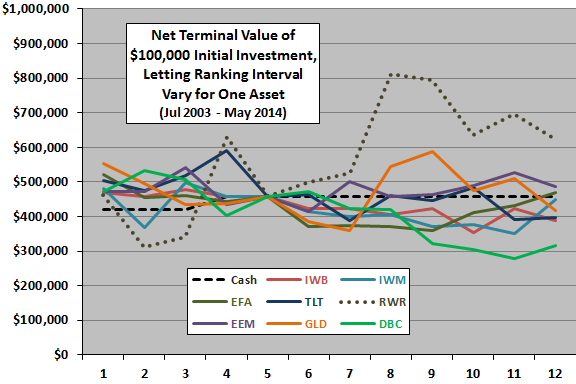
The following chart shows how the terminal value changes for each asset as its ranking interval varies from one month to 12 months, while the ranking interval for all other assets holds at five months. Some observations are:
- Terminal values for all nine lines converge to $458,393 at “5” because the ranking interval is five months for all assets at this setting.
- The average (median) terminal value for all combinations tested is $456,990 ($458,393).
- This most dramatic indication is improvement in terminal value from using a ranking interval of eight or nine months for RWR (with the ranking interval five months for all other assets).
- The most consistent indications are: shorter intervals for TLT increase terminal value; longer intervals for RWR increase terminal value; and, longer intervals for DBC decrease terminal value.
However:
- This test involves considerable snooping, such that the best (worst) outcomes is likely very lucky (unlucky).
- Setting the ranking intervals for each asset to its optimal value per the above process (four months for TLT, eight months for RWR, etc.) generates a terminal value of only $550,531, within an apparent “noise” range.
To the extent persistent asset behaviors (fundamentally driven cycles of some kind) drive variation, use of a separate ranking interval of eight months for RWR (and five months for all other assets) is most attractive. To the extent noise drives the variation, findings expose a caution that brute force experimentation (data snooping) fosters unrealistic expectations.
It is theoretically possible (though infeasible) to test all combinations of ranking intervals, with the ranking interval for each asset varying independently from one to 12 months. The snooping bias associated with such an exercise would be extreme.
In summary, evidence suggests that allowing different ranking intervals for one of the assets (with normalized past returns) sometimes helps and sometimes hurts the performance of the Simple Asset Class ETF Momentum Strategy.
To the extent that persistent cycles drives differences in outcomes, an investor using the strategy may want to allow some differences in ranking intervals. To the extent that differences in outcomes derive from randomness, an investor using the strategy would most rationally expect the average or median outcome (while prepared for worst case).
Cautions regarding findings include:
- The sample period is short for assessing sources of differences in outcomes.
- As noted, brute force experimentation introduces data snooping bias. The performance of the best (worst) variation tends to overstate (understate) expected performance of the strategy.