Does the effectiveness of momentum investing vary with market state? In the October 2011 version of their paper entitled “Market Cycles and the Performance of Relative-Strength Strategies”, Chris Stivers and Licheng Sun investigate how market cycles (bull versus bear) affect the profitability of medium-term and long-term relative strength investing strategies. They consider both firm-level and industry-level value-weighted relative strength strategies with equal ranking and holding intervals of 6, 12, 18, 24 and 36 months (ten total strategies), with an intervening skip-month. For the firm level, strategies are long (short) the top (bottom) tenth of ranking interval winners (losers). For the industry level, strategies are long (short) the top (bottom) five ranking interval winners (losers). Bull (bear) market states are those following 15% cumulative advances (declines) from previous troughs (peaks). Using monthly return data for individual NYSE/AMEX stocks and for 30 value-weighted industries during 1962 through 2010, they conclude that:
- Average gross profitability of relative strength strategies declines as ranking/holding interval increases.
- At the firm level, average gross monthly profits decline from 1.12% for the 6-month interval to -0.80% for the 36-month interval.
- At the industry level, average gross monthly profits decline from 0.55% for the 6-month interval to 0.07% for the 36-month interval.
- Based on the 15% advance/decline threshold, there are ten bull states and ten bear states during the sample period, with average (median) durations of 46.3 (36.5) months and 12.5 (12.0), respectively.
- Gross profitabilities of all ten strategies are materially higher when ranking and holding intervals are from the same market state, and extreme negative outcomes tend to occur around market state transitions.
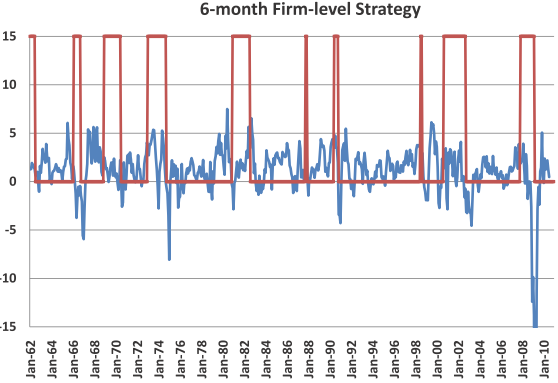
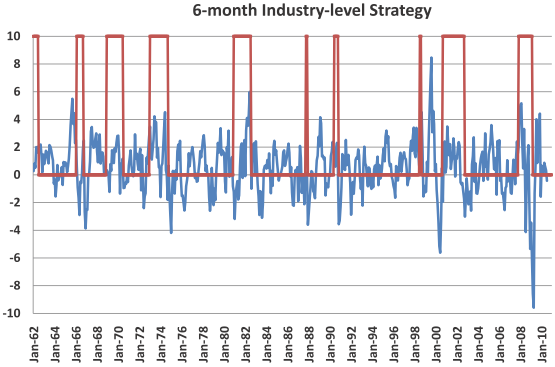
- For portfolios formed in April 2009 with exit from the 2007-2009 bear market, the cumulative gross return for the 6-month (12-month) relative strength strategy is -200% (-257%) at the firm level and -57% (-90%) at the industry level.
- For portfolios formed in January 1975 with exit from the 1973-1974 bear market, the cumulative gross return for the 6-month (12-month) relative strength strategy is -48% (-17%) at the firm level and -25% (-16%) at the industry level.
- For these shorter-interval strategies, average gross profits are materially lower during the second half of the sample period than the first half due to extreme negative returns around the 1991, 2002 and 2009 changes in market state.
- Long bull markets indicate strong relative strength strategy performance.
- For all ten relative strength strategies, lagged cross-sectional dispersion of stock returns relates negatively to future performance. For example, when the lagged 3-month moving average of stock return dispersion is below (above) its 75th percentile, average future monthly gross returns are 0.42% (-1.46%) at the firm level and 0.34% (-0.58%) at the industry level.
The following charts, taken from the paper, show as blue lines the performance of a relative strength (momentum) strategy with 6-month ranking and holding intervals applied at the firm (upper chart) and industry (lower chart) levels during 1962 through 2010. Returns are monthly percentages, calculated as the average over the holding interval. The red lines indicate bear markets (high value) and bull markets (low value).
Analysis indicates that the strategies perform poorly around times when the market is changing states.


In summary, evidence indicates that momentum investing strategies are generally more profitable: (1) for shorter (6-month) ranking intervals; (2) when the stock market that is not shifting between bull and bear states; and, (3) when the dispersion of returns across individual stocks or industries is relatively low (high).
It seems plausible that market adaptation to increasing use of momentum strategies may involve stronger and more frequent changes in market state.
Cautions regarding findings include:
- Return calculations are gross, not net. Trading frictions and costs of shorting would debit reported returns.
- As noted in “Momentum Overview from the Discoverers”, using a skip-month for return ranking appears appropriate for individual stocks (firm level) but not industries.
- The authors select a 15% advance/decline threshold for defining a change in market state based on retrospective intuition. Some other market state indicator (such as 10-month simple moving average crossings) might work differently.