In their July 2005 paper entitled “Momentum Profits and Non-Normality Risks”, Ana-Maria Fuertes, Joelle Miffre and Wooi Hou Tan examine the distributions of returns for nine momentum investing strategies as they attempt to explain why the resultant portfolios outperform. These nine strategies consist of overlapping portfolios formed monthly that are long (short) the equally weighted tenth of stocks with the highest (lowest) return over the past 3, 6 or 12 months and held for the next 3, 6 or 12 months. Using monthly data for all NYSE, AMEX and NASDAQ stocks priced over $5 during February 1973 through August 2004, they find that:
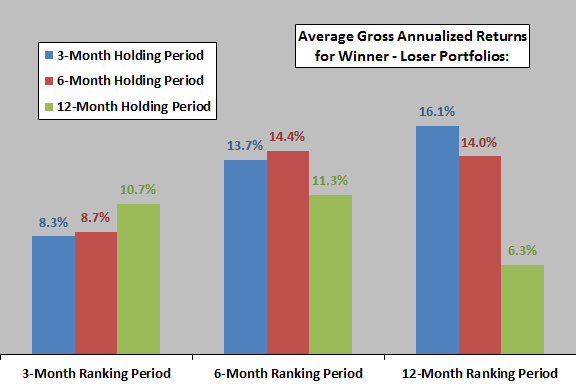
- All nine momentum strategies they examine show significant performance advantages for past winners over past losers (see chart below).
- The standard deviations of the past winner portfolios is consistently just smaller than those for past losers, so reward-for-volatility risk does not explain the outperformance of past winners.
- The distributions of winner returns consistently deviate more from normal than do loser returns, exhibiting a more negative skewness (the distribution curve tilts to the right) and kurtosis (flattened, with fat tails). Rewards for these distribution abnormalities may partially explain why momentum strategies work.
- Momentum portfolios tend to follow the rhythms of the business cycle, incorporating more risk (higher beta and more negative skewness) during economic expansions than during recessions.
- Efficient market theory still cannot explain fully the outperformance of momentum investing. Illiquidity and transaction costs may be part of the puzzle. The alternative view of behavioral economists, that momentum is a consequence of the market responding slowly to news, is still in play.
The following chart, constructed from data in the paper, summarizes gross annualized returns for all nine momentum strategy (winner minus loser) combinations based on ranking intervals of 3, 6 or 12 months and holding intervals of 3, 6 or 12 months. All portfolios generate considerably higher gross average returns for past winners than for past losers. Ranking based on a past performance period of 12 months and a holding period of three months produces the largest difference.

In summary, momentum investing works, and abnormalities in the distribution of returns for momentum-driven portfolios may partly explain why.
Note that accounting for trading frictions would materially reduce reported strategy returns.