Is there a best way to exploit unusual closed-end fund discounts to net asset value? In their July 2014 paper entitled “Exploiting Closed-End Fund Discounts: The Market May Be Much More Inefficient Than You Thought”, Dilip Patro, Louis Piccotti and Yangru Wu construct two regression models to predict closed-end fund returns:
- One model is a simple regression based on the past relationship between monthly fund discount and next-month fund return.
- The other augments the first by including a term that accounts for effects of changes in the discount over a recent (optimized) interval.
They test whether these models beat a naive strategy that trades only on current closed-end fund discounts. They focus on Sharpe ratio as a key performance metric. Using monthly prices, net asset values and classifications for 377 U.S. closed-end funds as available during August 1984 through December 2011 and contemporaneous monthly four-factor (market, size, book-to-market, momentum) and liquidity factor returns, they find that:
- A benchmark strategy that each month buys (sells) the fifth of available closed-end funds with the largest (smallest) discounts to net asset value generates a gross average annual return of 14.9% with Sharpe ratio 1.5.
- Annual portfolio turnover is 235%.
- The long side generates an gross average annual return of 14.8%, with Sharpe ratio 0.74 and turnover 212%.
- Using the first model each month to buy (sell) the fifth of funds with the highest (lowest) expected returns generates a gross average annual return of 17.3% with Sharpe ratio 1.9.
- Annual portfolio turnover is 294%.
- The long side generates a gross average annual return of 15.3%, with Sharpe ratio 0.78 and turnover 268%.
- Using the second, more complex model each month to buy (sell) the fifth of funds with the highest (lowest) expected returns generates a gross average annual return of 18.2% with Sharpe ratio 1.9.
- Annual portfolio turnover is 582%.
- The long side generates a gross average annual return of 16.3% with Sharpe ratio 0.83 and turnover 569%.
- Commonly applied risk factors do not explain strategy returns. Gross average annual five-factor alpha for the strategy based on the second, more complex model is 17.4%. The long side has a gross annualized average alpha of 10%.
- Results are generally robust across two subsamples of equal duration and across subsamples of domestic, foreign, equity and fixed income funds. However, the subsample of foreign funds produces a higher alpha than the subsample of domestic funds, and the subsample of fixed income funds produces a higher alpha than the subsample of equity funds.
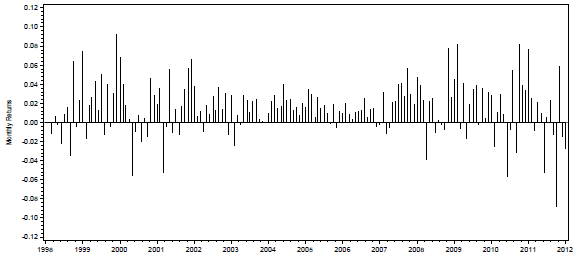
The following chart, taken from the paper, tracks monthly gross returns for the long-short strategy based on the second, more complex model as described above. This strategy is each month long (short) the fifth of available closed-end funds with the highest (lowest) expected returns. Data through January 1998 support initial model learning, such that the out-of-sample test period commences in February 1998.
Results indicate that strategy gross performance is fairly steady, with no obvious cycle or outliers. Performance is relatively attractive during the 2000-2002 and 2008 bear markets.
In summary, evidence indicates that investors may be able to exploit extreme closed-end fund discounts intelligently via models that relate past discount behaviors to future returns.
Cautions regarding findings include:
- Performance results are gross, not net. Trading frictions from monthly portfolio reformation and shorting costs would reduce these returns. Since turnover of the second, more complex model is much higher than those of the benchmark and simple regression models, it may not win on a net basis. [The author provided via email estimates that, based on a typical closed-end fund bid-ask spread of 0.67%: (1) the simple regression model outperforms the benchmark on a net basis by roughly 1% annually; but, (2) the second, more complex model underperforms the benchmark on a net basis by roughly 1% annually. However, the bid-ask spread is not the only portfolio maintenance cost.]
- Shorting of closed-end funds may be problematic/costly, suggesting focus on long-only performance.
- Many investors may not be able to hold a portfolio of closed-end funds diversified enough to capture outperformance reliably.
- Closed-end funds have limited aggregate capacity that may not accommodate very large investors.
- Optimization of the look-back interval for the interaction between past changes in fund discounts and future fund returns in the second, more complex model suggests potential for data snooping bias.
See also “ETF Price-NAV Gaps Exploitable?” and “A Play on ETF NAVs?”.