Should investors shun mutual funds with high fees? In their February 2017 paper entitled “Cheaper is Not Better: On the Superior Performance of High-Fee Mutual Funds”, Jinfei Sheng, Mikhail Simutin and Terry Zhang re-examine the conventionally accepted negative relationship between expense ratio and future net performance of actively managed equity mutual funds. They measure fund performance as alpha from each of four factor models of stock returns:
- 1-factor: the Capital Asset Pricing Model, which controls for the market factor.
- 3-factor: the widely used Fama-French model, which controls for market, size and value (book-to-market ratio) factors.
- 4-factor: the widely used Carhart model, which adds the momentum factor to the 3-factor model.
- 5-factor: the recent Fama-French model that adds profitability and investment factors to the 3-factor model.
They calculate alpha for each fund each month as the difference between next-month excess return minus expected return based on fund factor loadings from a regression over the last 60 months. They then use additional regressions and a ranking of funds into tenths (deciles) by fee to analyze relationships between alphas and fees. Using survivorship bias-free performance, sales channel and holding data for active U.S. domestic equity funds with at least five years of history and substantial holdings/assets during 1980 through 2014, they find that:
- Average fund history is 13.7 years, and average fee is 1.23%.
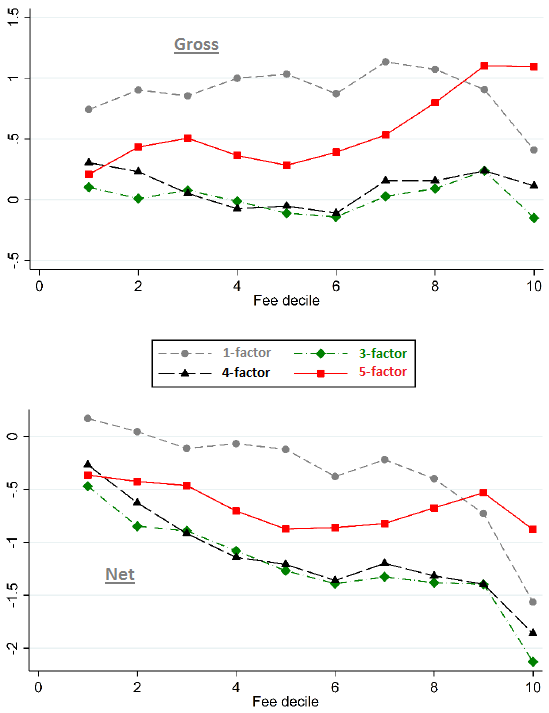
- Across all funds (regardless of fee):
- Monthly gross (before-fee) alphas are all non-negative, ranging from 0.00% for the 3-factor model to 0.08% for the 1-factor model.
- Monthly net (after-fee) alphas are all negative, ranging from -0.02% for the 1-factor model to -0.10% for the 3-factor model.
- On a gross basis, high-fee funds tend to outperform low-fee funds only for the 5-factor model (see the first chart below).
- On a net basis, high-fee funds perform about the same as low-fee funds for the 5-factor model. High-fee funds tend to underperform for the other three models (see the second chart below).
- On annual average, compared to stocks held by funds in the lowest fee decile, stocks held by funds in the highest fee decile:
- Grow their assets at a faster rate (19% vs 12%).
- Issue more equity (4% vs 2% of market capitalization).
- Have lower gross profit ratios (28% vs 34%).
- Concentrate holdings in firms that are hard to value.
- 5-factor alpha is a better predictor of fund survival than 4-factor alpha, particularly among funds held more by institutions and funds heavily invested in high-growth stocks.
The following charts, taken from the paper, compare average gross (upper chart) and net (lower chart) 1-factor, 3-factor, 4-factor and 5-factor annualized alphas in percent by mutual fund fee decile. In general, gross alphas are unrelated to fee for all except the positive relationship for the 5-factor model (0.9% per year higher for top minus bottom fee deciles). Net alphas relate negatively to fee for all except the 5-factor model, for which there is no significant relationship.
In summary, evidence indicates that, based on the Fama-French 5-factor model of stock returns, active U.S. equity mutual funds earn their fees on a gross basis (but do not share outperformance with investors).
Cautions regarding findings include:
- Testing multiple stock pricing models on the same data introduces snooping bias, overstating accuracy expectations of the best model.
- The authors do not address why investors would choose mutual funds that tend to hold stocks with low expected returns.