Which measure of mutual fund momentum best predicts future fund returns? In his August 2009 paper entitled “The 52-Week High, Momentum, and Predicting Mutual Fund Returns”, Travis Sapp examines the intermediate-term future performance of mutual funds ranked by: (1) nearness to the one-year high of the fund share net asset value; (2) prior six-month fund return; and, (3) fund sensitivity to stock return momentum. Using mutual fund returns for a broad sample of U.S. common stock funds and risk-adjustment data over the period 1970-2004, he concludes that:
- All three momentum measures have significant, independent power to predict fund returns.
- A strategy which buys the top 10% of funds and holds them for six months earns annualized risk-adjusted (for the Fama-French market, size and value factors) excess returns of 4.9%, 2.9% and 3.6% when ranking based on nearness to the one-year high, prior six-month return and sensitivity to stock return momentum, respectively.
- A strategy which buys the top 30% of funds and holds them for six months earns annualized risk-adjusted excess returns of 2.9%, 1.6%, and 2.4% when ranking based on nearness to the one-year high, prior six-month return and and sensitivity to stock return momentum, respectively.
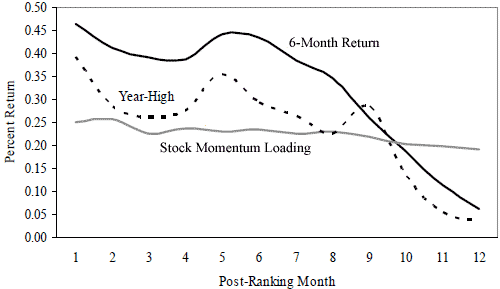
- Outperformance based on six-month returns are generally the largest, but this outperformance (along with that based on the nearness to the one-year high) tends to disappear 12 months after fund ranking. Outperformance based on sensitivity to stock return momentum is the smallest but least transitory. (See the chart below.)
- Nearness to the one-year high and past six-month return are significant predictors of monthly fund flows, whereas sensitivity to stock return momentum is not. In other words, investors appear to chase the two more transitory indicators of fund momentum.
The following chart, taken from the paper, shows the evolving risk-adjusted monthly returns for strategies that buy the top 10% of funds according to each of the three momentum rankings: (1) nearness to the one-year high of the fund share net asset value; (2) prior six-month fund return; and, (3) fund sensitivity to stock return momentum. For each post-ranking horizon, the return shown is the monthly alpha with respect to the Fama-French factors. The strategy based on past six-month fund return dominates initially, but the more abstract sensitivity to stock return momentum is more stable and persistent.

In summary, evidence suggests that past six-month fund return is a stronger indicator of mutual fund momentum than either nearness of fund net asset value to its one-year high or a more abstract sensitivity of fund returns to stock return momentum.