Are returns on real estate usefully predictable? In the June 2012 version of their book chapter entitled “Forecasting Real Estate Prices”, Eric Ghysels, Alberto Plazzi, Walter Torous and Rossen Valkanov examine the evidence of predictability in U.S. residential and commercial real estate markets. They review methodologies used in constructing widely used real estate price indexes. They then survey the key empirical findings from academic studies of short-run momentum and long-run reversals in real estate returns. Finally, they test the ability of different variables (past stock market return, stock market dividend yield, 3-month Treasury bill (T-bill) yield relative to its 12-month moving average, inflation rate, term spread between 5-year and 3-month maturities, combination of forward interest rates and industrial production growth) to predict real estate returns as calculated from several price indexes and a real estate investment trust (REIT) index. Using monthly and quarterly index levels for the real estate market proxies and values for the predictive variables as available, focusing on 1991 through 2010, they find that:
- The total value of the U.S. real estate market at the end of 2011 was about $25 trillion, of which residential properties constitute over $16 trillion, compared to a U.S. stock market capitalization of about $18 trillion.
- Compared to financial markets, the real estate market is geographically very heterogeneous and illiquid, with large search, transaction and carrying costs. Shorting is largely not possible.
- For residential properties:
- The average annualized gross growth rates of Census Bureau New Residential Sales (median sale price) and of repeat-sales from the Federal Housing Finance Agency (FHFA) House Price Index and the S&P/Case-Shiller Home Price Index are all about 3%, with annual volatilities ranging from 2.0% to 8.8%.
- The average annualized rent growth rate for the repeat-sale indexes is also about 3%, with very low volatility. The rent-to-price ratio is 4.5%, indicating a total average return (price appreciation plus rent) of 7.6%.
- For commercial properties, depending on the index used, average annualized gross returns are in the range 6.9% to 9.0%, with volatility 5.2% to 9.6%. The average gross return for commercial property REITs is about 10.4%, with volatility 17.9%.
- Evaluating the statistical significance of real estate forecast accuracy is challenging due to lack of long price series and serial correlation of returns. Regressions indicate that:
- Based on in-sample correlation analysis, prices exhibit momentum at horizons up to two or three years and reversal at horizons beyond three years.
- There is weak in-sample indication (statistically insignificant) of a positive relationship between current rent-price ratio and future residential real estate returns.
- The stock-market’s dividend yield, the relative T-bill yield and inflation significantly explain future changes in the S&P/Case-Shiller Home Price Index in-sample.
- The stock market’s dividend yield relates positively to future REIT index returns at an annual horizon in-sample during 1980-2010, but out-of-sample results are very weak.
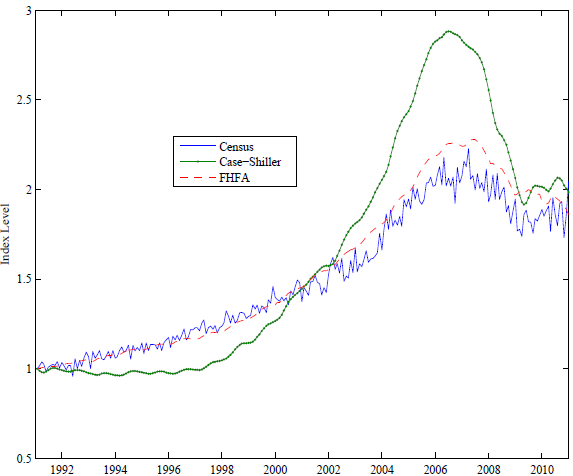
The following chart, taken from the book chapter, compares three indexes that measure gross U.S. residential real estate prices at a monthly frequency during 1991-2011: Census Bureau New Residential Sales (median sale price), the S&P/Case-Shiller Home Price Index and the FHFA House Price Index. These indexes are so different that results of similar analyses can conflict. For instance, the serial (month-to-month) correlation of the monthly change in the Census Bureau series is -0.51, while that of the S&P/Case-Shiller series is +0.94.
In combination with their relatively short histories, differences in these indexes make it very difficult to discover robust predictive variables.
In summary, evidence indicates that, except for REITs, real estate market heterogeneity and illiquidity make analysis of net investment performance very difficult. Data suggest that average return and volatility of REITs are higher (more stock-like in magnitude) than those of the underlying properties.
The book chapter includes extensive references to prior research.
Cautions regarding findings include:
- All reported returns are apparently gross, not net. Including reasonable trading frictions (which are very high for real estate but not for REITs) would reduce these returns.
- Results do not account for the data snooping bias (luck) involved in testing multiple hypotheses (predictive variables) on the same data sets, such that the best predictive powers are likely overstated.