The prevailing wisdom is that, in general, short sellers know what they are doing. But there are different kinds of short sellers, likely in a range from highly informed to noise. Can we find the ones who are best informed? In the November 2005 version of their paper entitled “Which Shorts Are Informed?”, Ekkehart Boehmer, Charles Jones and Xiaoyan Zhang examine a large proprietary dataset to segregate short-sellers according to the informativeness of their trading. Using data on short sales for an average of over 1,200 NYSE stocks daily during the period January 2000 through April 2004, they find that:
- Short sales comprise an average of at least 12.9% of NYSE volume, with the average short position lasting only 37 trading days. Institutional trades account for 74% of shorting, and NYSE member firms account for 20% of shorting. A small number of stocks account for most of the shorting.
- Shorting activity correlates positively with trading volume.
- Trading data suggests that short sellers trade to keep prices in line.
- Overall, short sellers are highly informed, with large short sale orders the most informative. Stock prices incorporate the information evidenced by a surge in short selling over the next 20 trading days, but not because of the monthly public release of short interest data.
- Stocks heavily shorted over the last five days underperform lightly shorted stocks by a risk-adjusted average of 1.07% during the following 20 trading days, excluding costs of shorting.
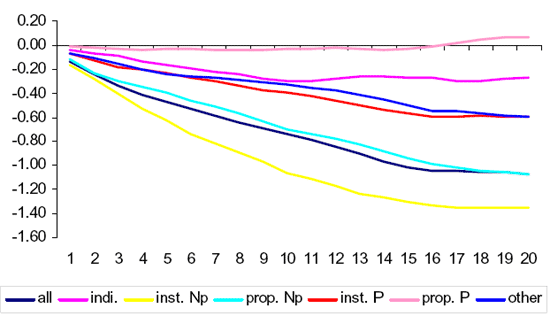
- Institutional non-program short sales are the most informative. A portfolio of stocks most heavily shorted by institutions over the past five days underperforms by a risk-adjusted average of 1.36% in the next 20 trading days, excluding costs of shorting.
- Because real-time short sales data is not publicly available, outsiders cannot achieve these returns.
The following chart, taken from the paper, compares the risk-adjusted alphas (returns for the quintile of stocks most shorted as a percentage of volume over the past five trading days minus returns for the quintile of stocks least shorted as a percentage of volume over the past trading five days) by kind of short seller over the next 20 trading days (about one calendar month). The kinds of short selling are: individual trades (“indi”); institutional non-program trades (“inst. Np”); NYSE member firm non-program trades (“prop. Np”); institutional program trades (“inst. P”); NYSE member firm program trades (“prop. P”); and, others, including options market-makers (“other”). The chart shows that non-program institutional short trades are most predictive of a decline in stock prices.

In summary, large short sellers generally know what they are doing. A rapid increase in short interest indicates abnormally low returns over the near term.
It would be interesting to examine whether rapid short-covering activity by big players indicates mirror-image abnormally high future returns.