Do legal, policy and practical constraints on short selling substantially detract from factor investing performance? In their February 2017 paper entitled “Factor Investing: The Rocky Road from Long Only to Long Short”, Marie Briere and Ariane Szafarz examine how severely constraints on short selling affect the attractiveness of factor investing. They consider 11 assets consisting of the value-weighted market and the separate long and short sides of five widely studied factors (size, value, profitability, investment and momentum). Short sides consist of the stocks typically shorted when quantifying factor returns, but they are not short portfolios. They use these 11 assets to construct five gross-of-costs mean-variance efficient sets of portfolios, all with net long exposure 100%:
- FF [Fama-French] Benchmark: 100% long the market, plus exposures to the 10 factor long and short sides, with respective long and short sides exactly offsetting (one positive and one negative).
- Global long-only: positive exposures only to all 11 assets.
- Long-short market + long-only factors: positive or negative market exposure, but positive exposures only to the 10 factor long and short sides.
- 130/30: total negative exposure to all assets capped at 30% of portfolio value.
- Global long-short: positive or negative exposures to all 11 assets.
Their principal analysis compares the efficient frontiers of these sets of portfolios. Using monthly market and factor long and short side returns as specified during July 1963 through December 2015, they find that:
- Regarding the 11 selected assets:
- Annualized returns range from 8.0% (low momentum) to 16.4% (high momentum).
- Annual volatilities range from 15.0% (big) to 21.6% (low momentum).
- Sharpe ratios range from 0.37 (low momentum) to 0.89 (high momentum).
- Correlations between factors range from 0.74 (between low momentum and high momentum) to 0.99 (between growth and aggressive investment).
- Correlations with the market range from 0.87 (low momentum) to 0.99 (big).
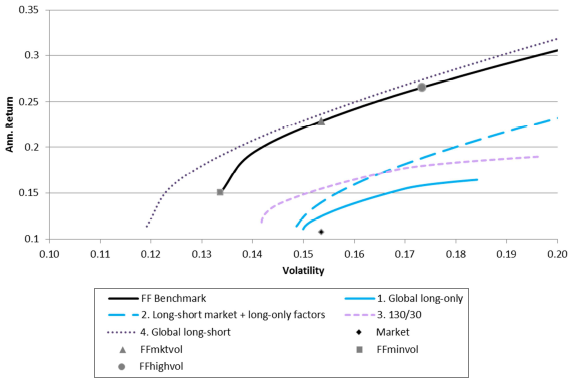
- Comparing the gross efficient frontiers of the five portfolios (see the chart below):
- The global long-short portfolio (the least constrained) has the most attractive frontier, followed closely by the FF benchmark set.
- The global long-only portfolio (the most constrained) has the least attractive frontier, other than the market portfolio.
- The moderately constrained long-short market + long-only factors and 130/30 portfolios are more attractive than global long-only, but much less attractive than the best two.
- A possible interpretation is that negative exposure to the market suppresses volatility, while negative exposures to factors let investors with low risk aversion accept leverage.
The following chart, taken from the paper, compares gross efficient frontiers for the five sets of portfolios specified above. It shows that imposing constraints on shorting substantially depresses portfolio performance. However, it also shows that constraining factor portfolios such that positive and negative exposures for each factor cancel (FF Benchmark) is a very attractive approach on a gross basis.
In summary, evidence indicates that imposing constraints on negative factor exposures can significantly depress mean-variance performance of an efficient factor-based portfolio.
Cautions regarding findings include:
- Analyses are gross, not net. As noted in the paper, portfolio turnover for some factors is low, but for momentum is high. Incorporating reasonable trading frictions would reduce returns.
- As noted in the paper, shorting can be costly or impossible, depending on shares available to borrow. Incorporating shorting costs may substantially reduce performance of affected portfolios.
- Mean-variance efficient portfolios may require high leverage on some of the 11 assets. The paper does not account for costs of leverage.
- Mean-variance efficiency analysis assumes that return distributions are tame. To the extent that distributions for the 11 assets are wild (non-normal), the theory breaks down.