Prior research indicates that individual stocks with high short interest relative to shares outstanding (short interest ratio) tend to underperform. Do this finding hold for exchange-traded funds (ETF)? In their December 2012 paper entitled “Why Does ETF Short Selling Provide a Different Signal?”, Christopher Hughen and Xiaoyu Ma investigate whether short interest ratio metrics predict future returns for ETFs. Their return measurement interval is from one mid-month short position settlement date (15th day of each month or the preceding business day) to the next. They define abnormal monthly return as ETF return minus the MSCI World Index return. Using so specified monthly short interest and total return data for 21 iShares single-country funds trading as of February 2002 from inception through December 2011 (3,419 fund-months), they find that:
- Over the entire sample period, the tenth of observations with the lowest (highest) monthly ETF short interest ratios are all below 0.7% (above 16.8%). The average monthly ETF total return is 0.46%.
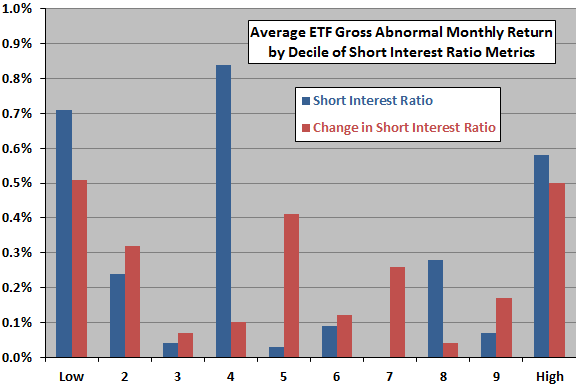
- ETFs with high short interest behave differently from individual stocks (see the chart below):
- The tenth (decile) of ETFs with the lowest (highest) short interest ratios outperform the MSCI World Index by an average 0.71% (0.58%) the next month.
- The tenth (decile) of ETFs with the biggest decreases (increases) in short interest ratios outperform the MSCI World Index by an average 0.51% (0.50%) the next month.
- Abnormal returns typically derive from stock market advances, not exchange rate movements.
- Finding are generally robust to changes in shares outstanding and different ways of normalizing short interest.
The following chart, constructed from data in the paper, summarizes average gross abnormal next-month total returns (relative to the MSCI World Index) by decile of short interest ratio, and by change in the short interest ratio, over the entire sample period. Results show that ETFs in extreme deciles tend to outperform the next month. A high short interest ratio does not indicate poor next-month return.
In summary, evidence indicates that short interest ratios have different indications for ETFs and individual stocks.
Institutional use of ETFs as hedges for portfolios of associated stocks may account for differences.
Cautions regarding findings include:
- Reported returns are gross, not net. Including trading frictions per month-to-month turnover of short interest ratio deciles would reduce these returns.
- With respect to exploitation of findings, the authors do not take into account a short interest publication delay of eight business days: “…firms are required to report their short positions as of settlement on (1) the 15th of each month, or the preceding business day if the 15th is not a business day, and (2) as of settlement on the last business day of the month. The reports must be filed by the second business day after the reporting settlement date. FINRA compiles the short interest data and provides it for publication on the 8th business day after the reporting settlement date.”