Do some short sellers employ sharp intraday attacks on targeted stocks to trigger temporary plunges, during which they cover at a profit? In the March 2007 draft of his paper entitled “Predatory Short Selling”, Andriy Shkilko examines empirical evidence of such behavior. Using all trades and quotes in Nasdaq-listed stocks during regular trading hours from April 2005 to April 2006, he identifies 1,482 potential predatory attacks and concludes that:
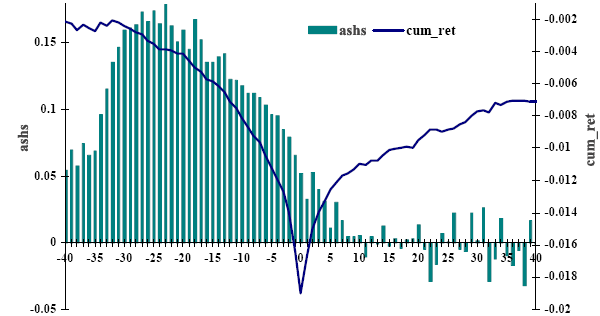
- During the average such event, stock price declines from the day’s open by 1.9% but subsequently recovers to a level 0.71% below the open. Such events rarely last longer than a day.
- Abnormal short selling intensifies as the stock price starts to decline, peaks about two hours before the intraday price minimum and gradually disappears within an hour after the price minimum. This abnormal selling creates a liquidity crisis, with the bid-ask spread increasing by 42% at the price minimum.
- During such events, short sellers trade aggressively (market or marketable limit orders) via venues that circumvent short sale restrictions.
- Stocks most susceptible to such events are recent underperformers with mid-range trading volume and market capitalization, high institutional ownership (easy to borrow) and a history of similar past events.
- These events are only weak predictors of future returns, suggesting that they are mostly self-contained trading ploys and not radical changes in fundamental expectations.
- In control samples of stocks that have intraday drops without subsequent reversals, abnormal short selling does not exhibit the above speculative pattern.
The following chart, taken from the paper, tracks abnormal short selling around extreme price reversals at 5- minute intervals. Abnormal short selling (ashs) is the difference between the percentage of short sales in the target stock and the marketwide percentage of short sales. The cumulative return (cum_ret) is from the open on the event day. The chart shows that abnormal short selling drives return down, while partial return recovery occurs with normal short selling activity.

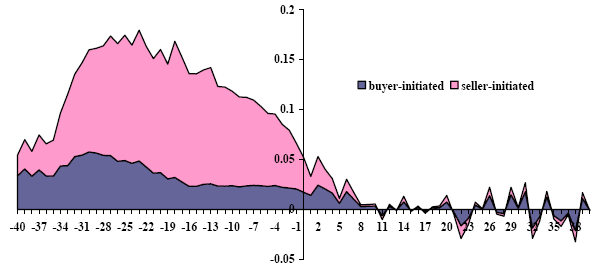
The next chart, also from the paper, compares buyer-initiated and seller-initiated abnormal short selling activity (based on market or marketable limit orders) at five-minute intervals around the intraday price minimum. Seller-initiated short sales peak at 82% of all abnormal short sales, but seller-initiated activity essentially disappears soon after price reverses.

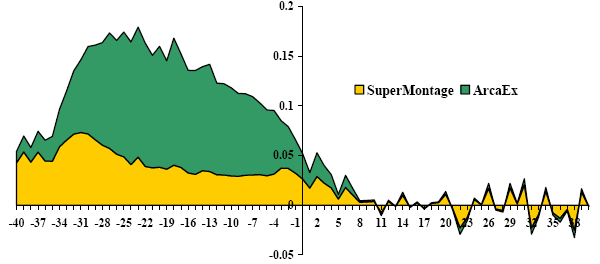
The final notably similar chart, also from the paper, compares the shares of abnormal short sales executed on SuperMontage and ArcaEx at five-minute intervals around the intraday price minimum. As much as 76% of all short sales take place on ArcaEx before price bottoms, but the ArcaEx activity essentially disappears soon after price reverses. As much as 92% of short sales routed to ArcaEx execute on a downtick.

In summary, it appears that some short selling is manipulative, seeking to scare other traders out of their holdings during sharp but temporary engineered price drops.