What factors make asset class diversification work? To investigate empirically, we consider the following mix of exchange-traded funds (ETF) as asset class proxies (the same used in “Simple Asset Class ETF Momentum Strategy”):
PowerShares DB Commodity Index Tracking (DBC)
iShares MSCI Emerging Markets Index (EEM)
iShares MSCI EAFE Index (EFA)
SPDR Gold Shares (GLD)
iShares Russell 1000 Index (IWB)
iShares Russell 2000 Index (IWM)
SPDR Dow Jones REIT (RWR)
iShares Barclays 20+ Year Treasury Bond (TLT)
3-month Treasury bills (Cash)
We calculate the monthly gross return-risk ratio (average monthly return divided by standard deviation of monthly returns) for an equally weighted, monthly rebalanced portfolio of all nine asset class proxies. We then recalculate the return-risk ratio nine times, each time excluding one of the assets, and relate the resulting return-risk ratios to three characteristics of the respectively excluded assets: (1) average monthly return; (2) standard deviation of monthly returns; and, (3) average (pairwise) cross-correlation of monthly returns with the other eight assets. The objective is to determine whether any of these three characteristics explain asset contribution to diversification benefit. We ignore trading frictions associated with monthly rebalancing, which would be similar for all combinations. Using dividend-adjusted monthly returns for the above nine asset class proxies during September 2006 (so that monthly returns for all assets are available in equal-weight calculations) through April 2014 (92 monthly returns), we find that:
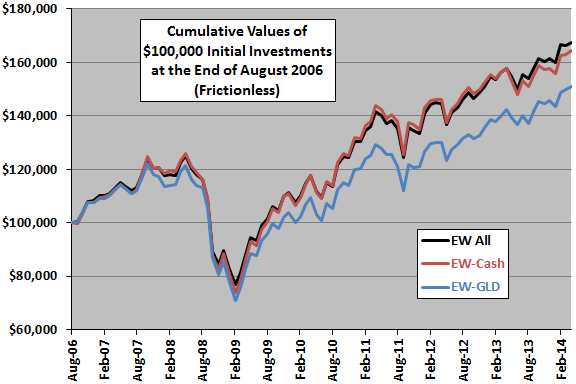
The following chart compares gross cumulative performances of $100,000 initial investments in:
- EW All – the equally weighted, monthly rebalanced combination of all nine asset class proxies.
- EW-Cash – the equally weighted, monthly rebalanced combination of all asset class proxies except Cash.
- EW-GLD – the equally weighted, monthly rebalanced combination of all asset class proxies except GLD.
Excluding Cash (GLD) from the portfolio is the least (most) damaging to terminal value. Terminal values from excluding the other seven assets one at a time fall between those for EW-GLD and EW-Cash.
How does the effect of excluding an individual asset relate to that asset’s return characteristics?

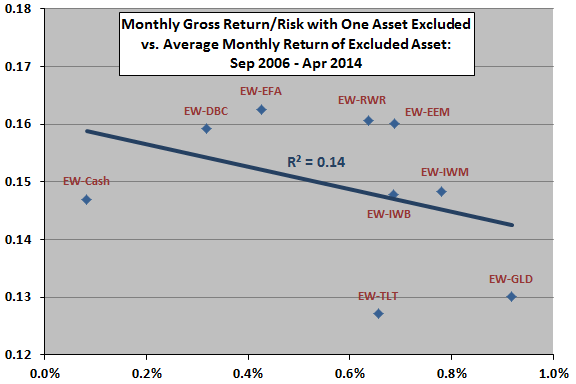
The following scatter plot relates monthly gross return-risk ratio for each of the nine equally weighted, monthly rebalanced portfolios that exclude one asset to average monthly return of the excluded asset over the sample period. The ratio for the portfolio including all nine assets is 0.16.
The slope of the best-fit line for the relationship is negative and the R-squared statistic is 0.14, suggesting that (unsurprisingly) excluding assets with high average returns hurts the portfolio more than excluding assets with low average returns. Excluding TLT or GLD is particularly harmful. Excluding EFA or RWR has little effect. However, the overall relationship is not strong, the number of assets considered is small, and the duration of the sample is short in terms of market cycles.
What about the role of asset return volatility?

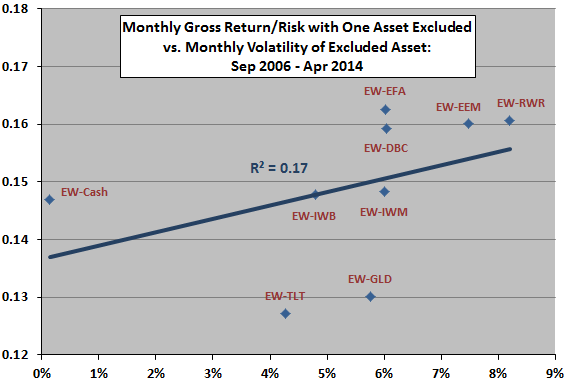
The next scatter plot relates monthly gross return-risk ratio for each of the nine equally weighted, monthly rebalanced portfolios that exclude one asset to monthly return volatility of the excluded asset over the sample period. As noted above, the ratio for the portfolio including all nine assets is 0.16.
The slope of the best-fit line for the relationship is positive and the R-squared statistic is 0.17, suggesting that excluding assets with low volatilities hurts the portfolio more than excluding assets with high volatilities. Again, the overall relationship is not strong, the number of assets considered is small, and the duration of the sample is short in terms of market cycles.
What about the role of average cross-correlation between excluded asset returns and returns for the other assets?

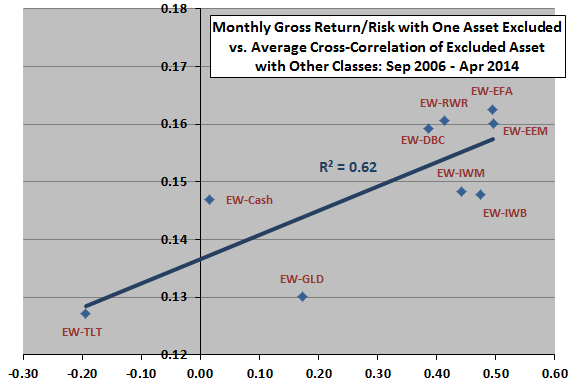
The final scatter plot relates monthly gross return-risk ratio for each of the nine equally weighted, monthly rebalanced portfolios that exclude one asset to the average cross-correlation of monthly returns between the excluded asset and the other assets over the sample period. As noted above, the ratio for the portfolio including all nine assets is 0.16.
The slope of the best-fit line for the relationship is positive and the R-squared statistic is 0.62, indicating that excluding assets with low average cross-correlations hurts the portfolio much more than excluding assets with high average pairwise correlations. The relationship is fairly strong, but the number of assets considered is small, and the duration of the sample is short in terms of market cycles.

In summary, evidence from a small set of observations suggests that diversification effectiveness depends primarily on combining assets with relatively low average cross-correlations of returns and secondarily on finding assets with relatively low return volatilities and high average returns.
Cautions regarding findings;
- As noted, the number of assets considered is too small and the sample period too short to support firm belief in findings. In other words, results are noisy and therefore notional.
- Moreover, it is plausible that introduction of easily traded asset class proxies via ETFs may stimulate correlation regime changes.
- The above analyses consider one independent variable at a time (univariate). Multivariate analyses may produce different results.
- Using terminal values rather than return-risk ratios produces somewhat different results, but terminal values are more sensitive to sample start and stop dates than return-risk ratios.
- As noted, the above analyses are frictionless. Including reasonable trading frictions for monthly rebalancing would lower performance for all portfolios.
- The diversification effectiveness of assets may not be the same as their effectiveness in contributing to a performance of a relative momentum strategy.