Are economic globalization and market financialization extinguishing diversification? In their October 2016 paper entitled “Nowhere to Run, Nowhere to Hide: Asset Diversification in a Flat World”, John Cotter, Stuart Gabriel and Richard Roll examine diversification within and across equity, government debt and real estate investment trust (REIT) indexes worldwide (a total of 40 indexes spanning 23 countries). They first use principal component analysis on returns available before 1986 to identify a set of 16 global asset pricing factors. They apply that factor model via linear regression to measure the degree to which daily returns behave differently across assets during 1986. From 1986 onward, they each year update the linear factor model based on daily index returns during that year and apply it to measure the degree to which daily returns behave differently across assets the following year. More specifically, they measure integration as the fraction of asset returns explicable by a common linear factor model, quantified as average R-squared statistic by market type (developed or emerging), country and by asset. They translate these integration metrics into diversification indexes with values ranging from 0 (no diversification potential) to 100. They then identify factors associated with diversification potential and assess the relationship between diversification indexes and investment risks. Using daily returns for 40 equity, bond, and real estate indexes in U.S. dollars spanning 23 countries as available through 2012 and focused on 1986 through 2012, they find that:
- Diversification indexes for equity, government debt and REIT indexes decline from a maximum level of 100 in the late-1990s to a 50-60 range by 2012. Results are similar for a composite of all three asset classes.
- The downtrend is most severe for government debt during the mid-2000s, with some rebound during the early years of the financial crisis.
- Older, more established country markets exhibit a stronger downtrend.
- Some countries (including many Middle Eastern and African nations) persistently display strong diversification potential, but often involve security, political, economic and liquidity risks (high transaction costs).
- The downtrend in diversification potential relates to general uptrends in return volatility (see the chart below), credit risk, proxied by the TED spread and technology/communications innovation.
- U.S. equity market option-implied volatility (VIX) relates negatively to equity index diversification potential, but positively to government debt diversification potential.
- Global crises generally coincide with sizable reductions in diversification potentials for all asset classes.
The following chart, taken from the paper, compares behaviors of a composite diversification index (as specified above, measured across asset classes and countries) and investment risk (return volatility). In general, as diversification potential falls, investment risk rises.
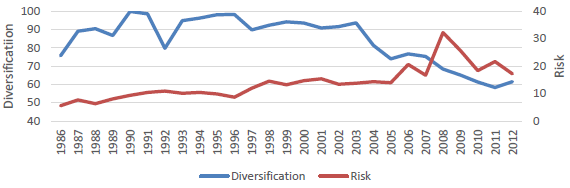
In summary, evidence indicates that global investment diversification potential across countries and asset classes is at an historically low level, and investment risk is correspondingly high.
Cautions regarding findings include:
- The sample period is not long in terms of number of economic/market cycles.
- An annual cycle is short for determination of a factor model.
- Indexes do not account for costs of maintaining a liquid, investable asset. Accounting for such costs by using funds rather than indexes (if possible) may affect findings.