What is the performance of the global multi-class market portfolio? In their June 2017 paper entitled “Historical Returns of the Market Portfolio”, Ronald Doeswijk, Trevin Lam and Laurens Swinkels estimate returns to a capitalization-weighted multi-class global market portfolio (GMP) during 1960 through 2015 in U.S. dollars. GMP encompasses all readily investable assets, allocated to four broad classes: equities, government bonds, corporate (nongovernment) bonds and real estate. They estimate nominal, real (relative to U.S. consumer inflation) and excess (relative to the risk-free rate) return and risk characteristics of GMP and its component asset classes over the full sample period, and during expansion/contraction and inflationary/disinflationary subperiods. They also compare GMP performance statistics to those for the following three heuristic (simple mean reversion) portfolios rebalanced annually to fixed weights:
- Equal-weighted (EW).
- Rank-weighted (RW), which assigns weights 40%, 30%, 20% and 10%, respectively, to equities, government bonds, corporate bonds and real estate.
- 50/50, which holds 50% equities and 50% government bonds.
Using annual data for the asset classes constructed according to Appendix A of the paper, annual yields for 3-month U.S. Treasury bills (T-bills) as the risk-free rate and annual U.S. consumer inflation rates, from the end of 1959 through 2015, they find that:
- On average over the full sample period, capitalization-weighted asset class contributions to GMP are 52.3% equities, 3.3% real estate, 15.1% corporate bonds and 29.3% government bonds.
- Over the full sample period, GMP has gross nominal (real):
- Compound annual growth rate, or CAGR, 8.35% (4.39%).
- Average annual growth rate 8.98% (5.07%).
- 11.5% (11.7%) standard deviation of annual returns.
- Sharpe ratio 0.69 (0.34).
- During the inflationary subperiod 1960-1979, GMP has gross real CAGR 2.27%. During the disinflationary subperiod 1980-2015, GMP has gross real CAGR 5.59% (see the chart below).
- Among component asset classes over the full sample period, equities generally drive GMP return and bonds suppress GMP volatility/drawdown (see the table below).
- CAGRs are positive in all decades for corporate bonds, government bonds and GMP.
- CAGRs are negative for real estate in the 1990s and equities in the 2000s.
- Pairwise correlations of annual real returns are 0.67 for equities-real estate, 0.50 for equities-corporate bonds, 0.28 for equities-government bonds, 0.45 for real estate-corporate bonds, 0.33 for real estate-government bonds and 0.87 for corporate bonds-government bonds.
- For the three simple heuristic portfolios over the full sample period:
- Gross real CAGRs range from 4.65% for 50/50 to 4.89% for EW, compared to 4.39% for GMP.
- Maximum drawdowns (annual data) range from -37.8% for EW to -32.1% for 50/50, compared to -38.1% for GMP.
- Gross real annual Sharpe ratios range from 0.37 for EW to 0.40 for 50/50, compared to 0.34 for GMP.
- Two-way turnovers from annual rebalancing range from 6.9% for 50/50 to 7.9% for EW, compared to 3.2% for GMP.
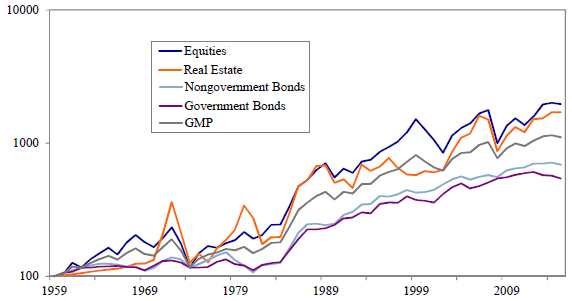
The following chart, taken from the paper, compares gross cumulative real performances of $100 initial investments in GMP and each component asset class. Real CAGRs are 4.39% for GMP, 5.45% for equities, 5.19% for real estate, 3.50% for corporate (nong0vernment) bonds and 3.06% for government bonds. During this period, the risk-free asset (U.S. T-bills) has real CAGR 1.10%. The chart shows that most assets perform better in the later disinflationary environment than in the earlier inflationary one.
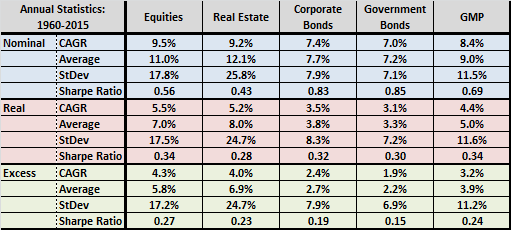
The following table, constructed from data in the paper, summarizes some key gross annual performance statistics for GMP and its component asset classes over the full sample period. In general, equities and real estate have higher returns and volatilities than do the two bond classes.
In summary, evidence indicates that the capitalization-weighted portfolio of readily investable global assets has CAGR about 4.4% during 1960-2015.
Table 6 in the paper provide allocations and returns (nominal, real, excess) for the global market portfolio by year for the full sample period.
Cautions regarding findings include:
- Construction of the asset classes involves approximations and dovetailing of different sources.
- Reported performance statistics are gross. Construction of some parts of GMP may have been costly during part or all of the sample period, with trading frictions differing according to liquidity.