Is diversification across stock and bond factors superior to diversification across asset classes? In their August 2013 report entitled “Investing in Systematic Factor Premiums”, Kees Koedijk, Alfred Slager and Philip Stork measure the gross performances of widely used stock and bond factors and pit portfolios diversified across those factors against portfolios diversified across asset classes. For equities, they examine market, size, value, momentum and low-volatility factors. For bonds, they examine market, term spread, credit spread, high-yield, short-term credit yield and short-term government yield factors. They consider both U.S. and European data as available. They take an institutional perspective and therefore restrict consideration to simple, long-only portfolios. For asset class diversification, they consider stocks-bonds and stocks-bonds-commodities-real estate. They ignore all trading frictions involved in constructing factor portfolios and in rebalancing multi-asset and multi-factor portfolios. Using monthly prices for U.S. and European stocks, bonds, Real Estate Investment Trust (REIT) indexes and a common global commodity index as available through mid-to-late 2012, they find that:
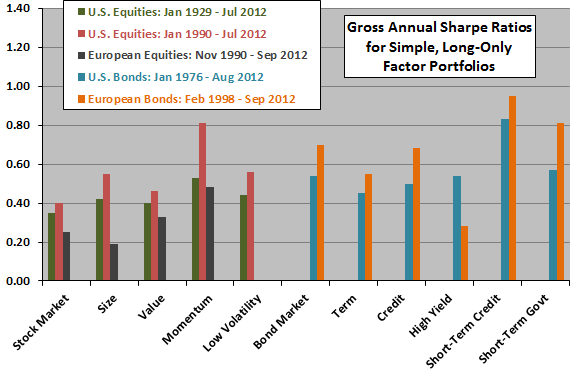
- Performances of simple, long-only factor portfolios are (see the first chart below):
- For U.S. equities during January 1929 through July 2012, size, value, momentum and low-volatility factor portfolios outperform the market based on gross annualized return and annual Sharpe ratio. The momentum portfolio has the highest gross annualized return (12.5%), highest gross annual Sharpe ratio (0.53) and lowest maximum drawdown (77.3%).
- For U.S. equities during Jan 1990 through July 2012, size, value, momentum and low-volatility portfolios outperform the market based on gross annualized return and annual Sharpe ratio. The size portfolio the highest gross annualized return (13.1%), the momentum portfolio has the highest gross annual Sharpe ratio (0.61), and the low-volatility portfolio has the lowest maximum drawdown (44.3%).
- For U.S. bonds during January 1976 through August 2012, the protracted decline in interest rates produces returns almost as high as equity market returns. Most of the simple factor portfolios perform at least as well as the market portfolio. The high-yield portfolio has the highest gross annualized return (9.9%), and the short-term credit portfolio has the highest gross annual Sharpe ratio (0.83).
- For European equities during November 1990 through September 2012, simple long-only size (value and momentum) factor portfolios underperform (outperform) the market based on gross annualized return and annual Sharpe ratio. The momentum portfolio has the highest gross annualized return (13.7%), highest gross annual Sharpe ratio (0.48) and lowest maximum drawdown (60.3%).
- For European bonds during February 1998 through September 2012, performances of simple factor portfolios relative to the market portfolio are mixed. The term spread portfolio has the highest gross annualized return (8.4%), and the short-term credit portfolio has the highest gross annual Sharpe ratio (0.95).
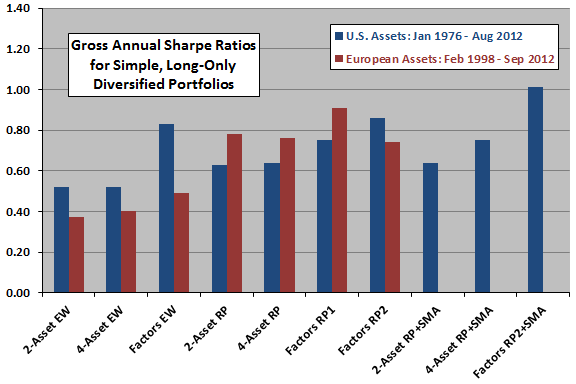
- In general, based on gross performance metrics, factor diversification outperforms asset class diversification for equal weighting, risk parity weighting, and risk parity weighting with 10-month simple moving average (SMA) crash protection (see the second chart below).
The following chart, constructed from data in the report, summarizes gross annual Sharpe ratios for simple long-only, portfolios designed to capture various equity and bond factor premiums. Among equity (bond) factors, momentum (short-term credit) stands out.

The next chart, also constructed from data in the report, summarizes gross annual Sharpe ratios for the following simple diversification schemes:
- 2-Asset EW: stocks and bonds equally weighted
- 4-Asset EW: stocks, bonds, commodity index and REIT index equally weighted
- Factors EW: 50% equally weighted stock factors and 50% equally weighted bond factors
- 2-Asset RP: stocks and bonds weighted by inverse of volatility exponential moving average (EMA)
- 4-Asset RP: stocks, bonds, commodity index and REIT index weighted by inverse of volatility EMA
- Factors RP1: all stock and bond factors weighted by inverse of volatility EMA
- Factors RP2: equally weighted stock factor sub-portfolio and equally weighted bond factor sub-portfolio combined by weighting sub-portfolios by inverse of volatility EMA
- 2-Asset RP+SMA: same as 2-Asset RP, except each month any position goes to cash when below its 10-month SMA
- 4-Asset RP+SMA: same as 4-Asset RP, except each month any position goes to cash when below its 10-month SMA
- Factors RP2+SMA: same as Factors RP2, except each month any position goes to cash when below its 10-month SMA
In general, for a given diversification method, factor diversification outperforms asset class diversification. However, accounting for trading frictions could disrupt rankings.

In summary, evidence from U.S. and European data indicates that factor diversification outperforms comparable asset class diversification for simple, frictionless, long-only implementations.
Cautions regarding findings include:
- As noted in the report, all findings are based on gross, not net, returns. Incorporating reasonable trading frictions would lower returns both for individual factor portfolios and for portfolios diversified across asset classes or factors. Moreover:
- Portfolio turnover may vary by factor, such that net relative performance of factors may differ from gross relative performance.
- Diversified portfolios may involve different levels of construction/rebalancing frictions, potentially affecting the relative performance of factor and asset class diversification.
- Use of different sample periods for estimating factor premiums confounds comparison of premiums.
- As described in the report, factor premiums are long-only and attend to institutional implementation constraints. Other factor implementations may produce different results.
- Use of indexes rather than tradable assets to represent commodities and real estate ignores costs of creating tradable funds, thereby overstating returns.
- As noted in the report, there is a secular decline in interest rates during most of the sample periods. This decline may be critical to findings and may not be representative of future economic conditions.
- Layering of rules for combining assets/factors in diversified portfolios elevates likelihood of data snooping bias in results.
- Data collection/computing resources may have been insufficient during early parts of some sample periods to implement some factor and diversification portfolios. The subsequent availability of such resources may have changed the markets.