
Is it suboptimal to employ the same asset class proxy universe both to exploit momentum and to avoid crashes? In their July 2018 paper entitled “Breadth Momentum and the Canary Universe: Defensive Asset Allocation (DAA)”, Wouter Keller and Jan Willem Keuning modify their Vigilant Asset Allocation (VAA) by substituting a separate “canary” asset class universe for crash protection based on breadth momentum (percentage of assets advancing). VAA is a dual momentum asset class strategy specifying momentum as the average of annualized total returns over the past 1, 3, 6 and 12 months, implemented as follows:
- Each month rank asset class proxies based on momentum.
- Each month select a “cash” holding as the one of short-term U.S. Treasury, intermediate-term U.S. Treasury and investment grade corporate bond funds with the highest momentum.
- Set (via backtest) a breadth protection threshold (B). When the number of asset class proxies with negative momentum (b) is equal to or greater than B, the allocation to “cash” is 100%. When b is less than B, the base allocation to “cash” is b/B.
- Set (via backtest) the number of top-performing asset class proxies to hold (T) in equal weights. When the base allocation to “cash” is less than 100% (so when b<B), allocate the balance to the top (1-b/B)T asset class proxies with highest momentum (irrespective of sign).
- Mitigate portfolio rebalancing intensity (when B and T are different) by rounding fractions b/B to multiples of 1/T.
DAA replaces step 3 with breadth protection calculated the same way but based on a separate, simpler asset universe, selected experimentally from pre-1971 data based on a unique indicator that that combines compound annual growth rate (R) and maximum drawdown (D). The aim of DAA is to lower the average cash allocation fraction compared to VAA while preserving crash protection. They describe assets in terms of existing exchange-traded funds (ETF) but use best available matching indexes prior to ETF inceptions. Using monthly return data for alternative canary assets during 1926-1970, for backtest (in-sample) DAA universe parameter optimization during 1971-1993 and for out-of-sample DAA universe testing during 1994 through March 2018, they find that:
- The optimal DAA canary universe during 1926-1970 based on the specified return-drawdown performance metric consists of two assets: the best available index proxy for the Vanguard Emerging Markets Stock Index ETF (VWO) and the the best available index proxy for the Vanguard Total Bond Market ETF (BND), with breadth protection threshold 2.
- The average cash fraction for DAA is often less than half that of VAA, while return and risk are mostly better (see the table below).
- Substitution of the separate canary universe for crash protection improves tracking error relative to a buy-and-hold benchmark and lowers turnover.
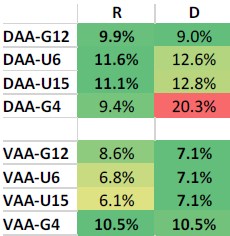
The following table, extracted from the paper, compares compound annual growth rates (R) and maximum drawdowns (D) for DAA and VAA during March 2008 through March 2018 (when selected ETFs are all available) as applied to four asset class universes for exploiting momentum:
- G12 – SPY, IWM, QQQ, VGK, EWJ, VWO, VNQ, GSG, GLD, TLT, HYG and LQD.
- U6 – four Fama-French U.S. size-value portfolios, BIL and LQD.
- U15 – 10 Fama-French sector portfolios, BIL, IEF, LQD, TLT and HYG.
- G4 – SPY, VEA, VWO and BND.
In all cases, any cash allocation is to the best performer among SHY, IEF and LQD. DAA outperforms VAA based on compound annual growth rate for three of four asset universes (substantially so for two) but underperforms based on maximum drawdown for all four.
In summary, evidence indicates that employing a simple “canary” asset class universe for crash avoidance may improve the performance of a dual momentum asset class strategy.
Cautions regarding findings include:
- The cautions outlined for VAA in “Conservative Breadth Rule for Asset Class Momentum Crash Protection” apply.
- The recent test period highlighted above, which includes the unusual 2008-2009 financial crisis, is not long for reliable inference. However, liquid ETFs are available for realistic testing.
Frequently Asked Questions
What is Defensive Asset Allocation (DAA) and what does a canary universe mean in investing?
Defensive Asset Allocation (DAA) is a dual momentum asset class strategy from Wouter Keller and Jan Willem Keuning that uses a separate, simpler "canary" asset universe to trigger crash protection based on breadth momentum (the share of assets with negative momentum). The canary universe is distinct from the universe used to exploit momentum. The optimal canary universe found for 1926-1970 consists of proxies for emerging markets stocks (VWO) and the total bond market (BND), with a breadth protection threshold of 2.
Does using a separate canary universe improve a momentum asset allocation strategy?
A separate canary universe may improve a dual momentum strategy, according to the DAA research. During March 2008 through March 2018, DAA beat Vigilant Asset Allocation (VAA) on compound annual growth rate in three of four asset universes (substantially in two) but had higher maximum drawdowns in all four. DAA's average cash fraction was often less than half that of VAA, with improved tracking error versus buy-and-hold and lower turnover.
How does breadth momentum crash protection work in the DAA strategy?
Breadth momentum crash protection in DAA counts the number (b) of canary assets with negative momentum, where momentum is the average of annualized total returns over the past 1, 3, 6 and 12 months. If b is equal to or greater than the breadth threshold (B), the allocation to cash is 100%; otherwise the base cash allocation is b/B, with the balance going to the top-momentum assets. The canary universe was chosen from 1926-1970 data using a metric combining compound annual growth rate and maximum drawdown, optimized in-sample over 1971-1993 and tested out-of-sample from 1994 through March 2018.
How does DAA compare to Vigilant Asset Allocation (VAA)?
Defensive Asset Allocation (DAA) differs from Vigilant Asset Allocation (VAA) in that VAA derives breadth protection from the same asset universe used to select momentum holdings, while DAA uses a separate, simpler canary universe. This lowers DAA's average cash allocation, often to less than half of VAA's, while aiming to preserve crash protection. In March 2008-March 2018 tests across four universes (G12, U6, U15, G4), DAA had higher compound annual growth in three but larger maximum drawdowns in all four.
What are the limitations of the DAA canary universe approach?
The DAA canary universe approach has limitations: the cautions that apply to VAA also apply, and the recent test period (March 2008-March 2018) is too short for reliable inference. That period also includes the unusual 2008-2009 financial crisis. DAA also showed higher maximum drawdowns than VAA in all four tested asset universes, though liquid ETFs are available for realistic testing.