At the suggestion of one of his subscribers, Willi Bambach requested independent review of his 1g QMP [Quantified Market Psychology] strategy, tracked since December 2007 on TimerTrac. To facilitate a review, he provided a brief description of the strategy and a medallion (https://timertrac.com/private/medallion.asp?mlid={CDD4AEE6-2A1D-4917-A571-DF23C884D1D3}) to enable public access to the strategy on TimerTrac (very slow to load and may no longer work). The strategy has asset universe, asset allocation and position leverage components as follows:
- Asset universe:
- Cash in a money market fund (with assumed 2% fixed yield).
- SPDR S&P 500 ETF Trust (SPY)
- iShares 20+ Year Treasury Bond ETF (TLT).
- Allocations as signaled mostly per the following three steps:
- Examine differences between FactSet consensus analyst earnings forecasts and actual earnings for S&P 500 stocks.
- Relate these differences to earnings release price reactions of respective stocks.
- Translate this relationship into a sentiment signal that specifies allocations for Cash, SPY and TLT.
- Leverage (with assumed 0.5% fixed financing cost) for SPY and TLT positions added in 0.5 increments as long as three conditions hold for inception-to-date data (as the sample grew, this approach evolved to constant 2X leverage over the last five years):
- Standard deviation of 1g QMP returns is lower than than that for the S&P 500 Index.
- Downside standard deviation of 1g QMP returns is lower than that for the S&P 500 Index.
- 1g QMP Ulcer Index is lower than that for the S&P 500 Index.
Data available via this medallion include a list of 1g QMP allocation changes by date (see the table at the end). For testing 1g QMP, we do not attempt to replicate allocations. Instead, we apply a set of tractable assumptions to them and test versions of 1g QMP with 1X (no leverage) and 2X leverage. We use SPDR Bloomberg 1-3 Month T-Bill ETF (BIL) for cash to approximate money market yields and avoid estimating settlement delays. We supply 2X leverage by substituting ProShares Ultra S&P500 (SSO) for SPY and ProShares Ultra 20+ Year Treasury (UBT) for TLT. We focus on net average daily return, standard deviation of daily returns, daily return/risk (average divided by standard deviation), compound annual growth rate (CAGR), maximum drawdown and annual Sharpe ratio. We use average end-of-month 3-month U.S. Treasury bill (T-bill) yield during a year as the risk-free rate for that year in Sharpe ratio calculations. We do not include partial years in Sharpe ratio calculations. Using the list of strategy allocation changes and daily dividend-adjusted prices of BIL, SPY, TLT, SSO and UBT during 1/25/2008 through 11/30/2023, we find that:
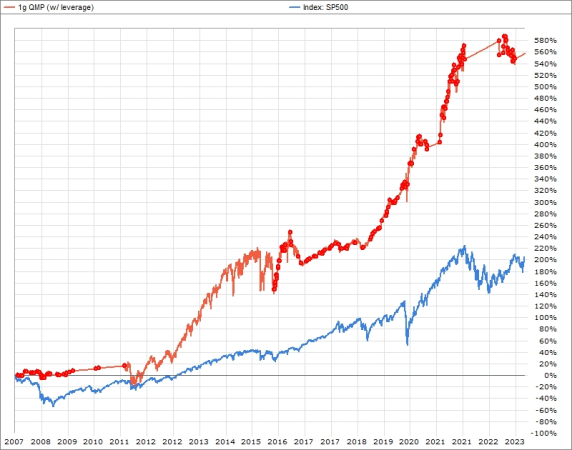
The following chart, extracted from TimerTrac via the medallion, tracks 1g QMP strategy cumulative return since the end of 2007, with S&P 500 Index cumulative return shown as a benchmark. Notable points are:
- The indicated CAGR is about 11.8%.
- Determining exact intervals is problematic since three years appear twice in the chart.
- Total return for SPY during 12/29/2006 through 11/30/2023 is 346%, much higher than shown for the S&P 500 Index in the chart. It appears index numbers ignore dividends.
- A strategy using leverage should arguably have a benchmark using leverage.
For testing of 1g QMP, we:
- Track the strategy daily due to the irregularity of reallocations and close proximity of some reallocations.
- Reallocate at the close on listed dates (do not rebalance between reallocation dates).
- If there is more than one reallocation per date, use the later one.
- If the reallocation date is not a trading day, trade at the next close.
- Debit 0.1% of the amount traded as trading frictions.
- Reinvest all dividends in the paying asset immediately and frictionlessly.
- For the 1x leverage version, use buy-and-hold SPY as the benchmark.
- For the 2x leverage version, use buy-and-hold SSO as the benchmark. Since UBT inception is 1/21/2010, use TLT in the 2X leverage version before that date.
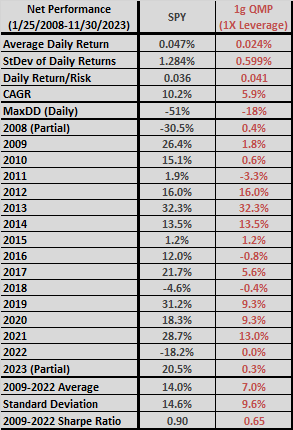
The following table summarizes net performance statistics for SPY and the 1X version of 1g QMP. Notable points are:
- 1g QMP suppresses volatility and drawdown compared to SPY at the cost of materially lower returns, such that its Sharpe ratio is lower.
- Including partial year 2008 (2023) would raise (lower) Sharpe ratio for 1g QMP.
1g QMP is somewhat sensitive to the assumed level of trading frictions. Eliminating frictions boosts CAGR from 5.9% to 6.2%. Increasing frictions from 0.1% to 0.2% reduces CAGR to 5.6%.
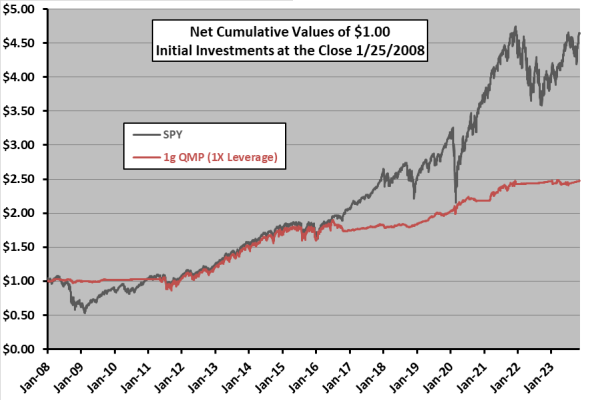
For perspective, we look at cumulative performances.
The next chart tracks the net value of $1.00 initial investments at the close on 1/25/2008 in SPY and 1g QMP with no leverage. 1g QMP outperforms early in the sample period by avoiding the 2008-2009 crash, roughly matches SPY during the rest of the first half of the sample period by being 100% in SPY and then lags SPY for nearly all the second half of the sample period but with much lower volatility.
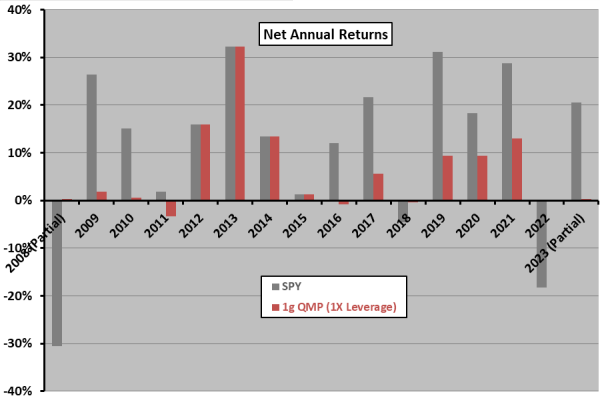
For another perspective, we look at annual returns.
The next chart summarizes annual net returns for SPY and 1g QMP with no leverage. The latter avoids large drawdowns but often substantially underperforms.
Next, we look at the 2X version.
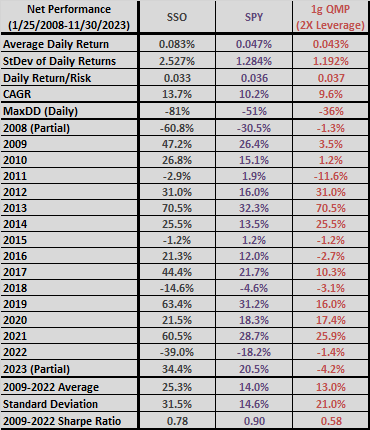
The next table summarizes net performance statistics for SSO and the 2X version of 1g QMP. It includes results for SPY from the above table for reference. Notable points are, again:
- 1g QMP suppresses volatility and drawdown compared to SSO at the cost of materially lower average returns, such that its Sharpe ratio is lower.
- Including partial year 2008 (2023) would raise (lower) Sharpe ratio for 1g QMP.
1g QMP is somewhat sensitive to the assumed level of trading frictions. Eliminating frictions boosts CAGR from 9.6% to 9.9%. Increasing frictions from 0.1% to 0.2% reduces CAGR to 9.3%. SSO and UBT are likely more costly to trade than SPY and TLT.
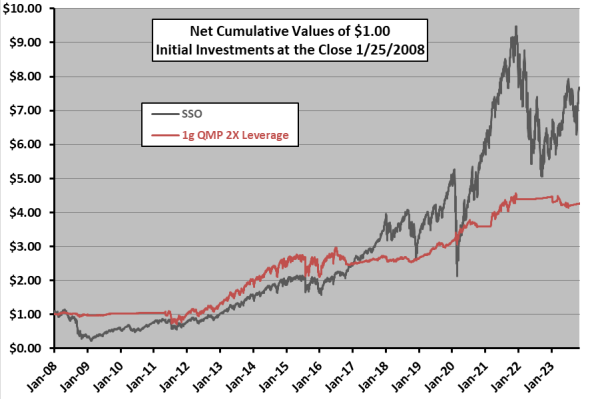
For perspective, we again look at cumulative performances.
The following chart tracks the net value of $1.00 initial investments at the close on 1/25/2008 in SSO and 1g QMP with 2X leverage. 1g QMP outperforms during the first half of the sample period by avoiding the 2008-2009 crash. During the second half of the sample period, it almost always lags SSO but with much lower volatility.
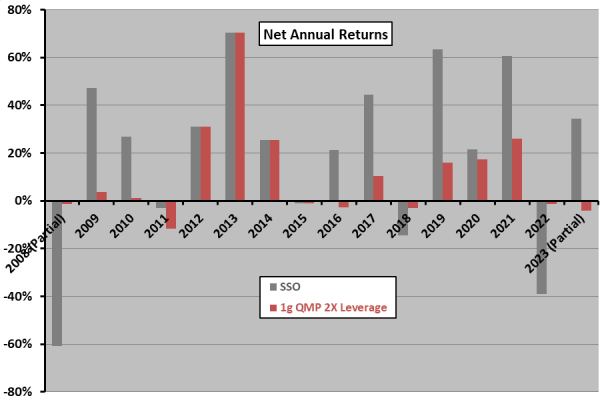
For another perspective, we again look at annual returns.
The final chart summarizes annual net returns for SSO and 1g QMP with 2X leverage. Again, the latter avoids large drawdowns but often substantially underperforms.
In summary, tests that approximate 1g QMP performance in a practical setting suggest that risk-averse investors may appreciate its return-risk outcomes, while long-term risk-tolerant investors may prefer the benchmarks.
Cautions regarding findings include:
- Given the high variabilities of returns, especially for SSO and 2X 1g QMP, the sample period is short for reliable inference. The start date, at the beginning of the 2008-2009 financial crisis, is lucky for market timing strategies.
- Results do not include the cost of subscribing to TimerTrac for access to strategy signals.
- Results do not account for tax implications of trading. In taxable accounts, the benchmarks would generate much lower taxes.
- Using margin rather than SSO and UBT may produce different results, but maintaining leverage may be cumbersome and incurs frictions. Cost of margin varies by broker.
- This review may impound attention bias since those offering strategies not ostensibly doing well are unlikely to request an independent and public review.
After previewing the performance statistics in the tables above (and prior concurrence with assumptions), Willi Bambach stated: “I respect your analyses although I do not agree with you.” He has not responded to a request for explicit points of disagreement.
Because access to TimerTrac via the medallion is spotty, we include here the list of QMP reallocations (197 observations over 15.8 years during January 2008 through November 2023), with no reallocations recorded after 7/28/2023:
